⚡️ TL;DR
- Level 1 context diagrams are useful for showing a simple architecture with one or a few primary systems but don’t scale to multi-system architectures.
- A system landscape diagram (Level 0) provides an organizational overview of your architecture, grouping multiple systems together and the relationships between them.
- These diagrams are an entry point for understanding the broader architecture before diving into individual context diagrams.
- IcePanel uses Domains instead of dedicated landscape diagrams to group systems by business units or product areas.
🤔 The problem with Level 1 diagrams
Level 1 context diagrams are meant to communicate the big picture of your architecture. For small teams with a simple architecture and one primary system, a single context diagram can capture this well.
A context diagram with a single internal system.
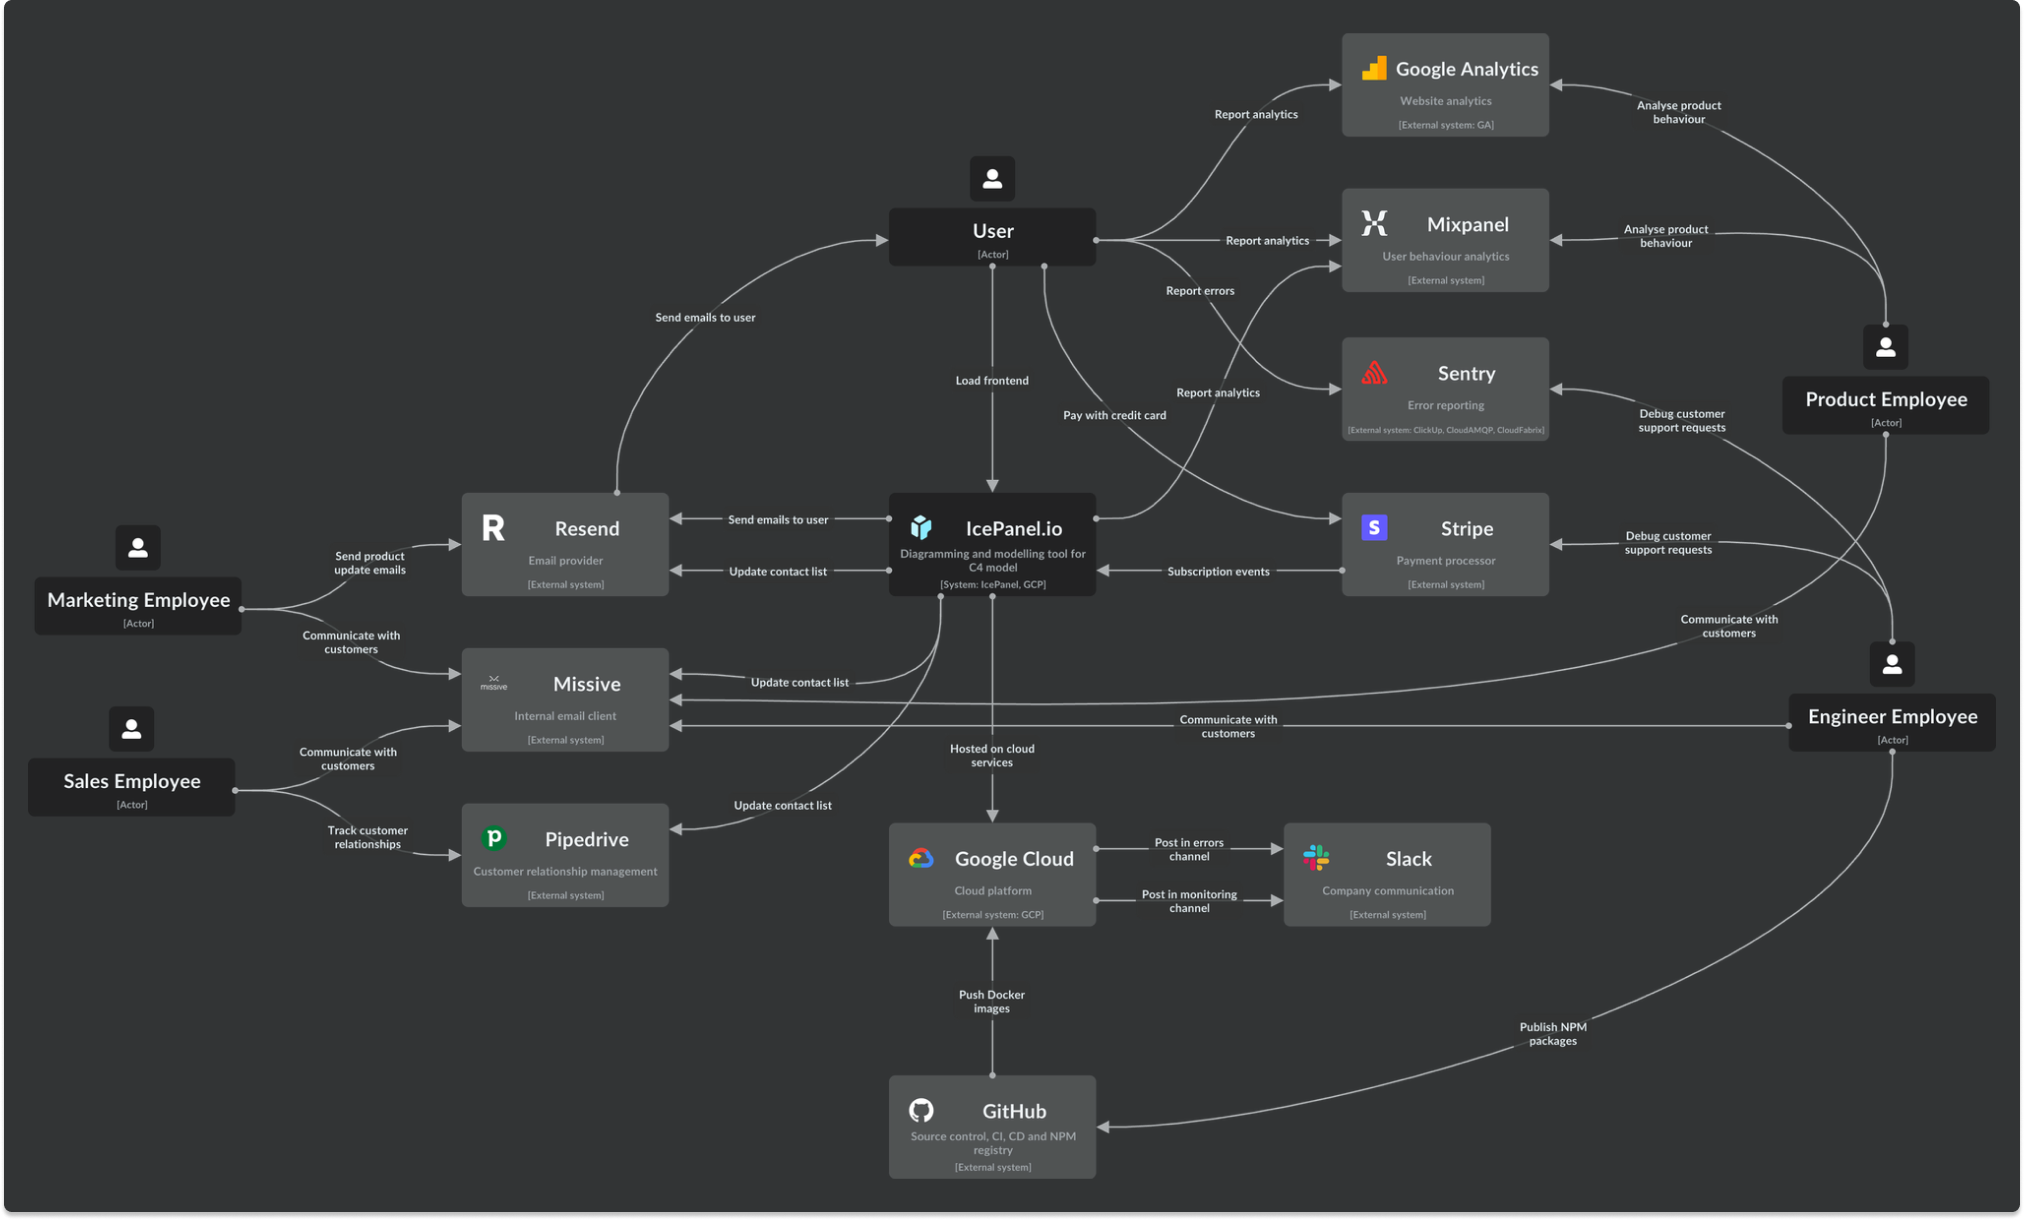
However, teams with complex systems start encountering scalability issues with Level 1 diagrams. A system in the C4 model is defined as something that delivers value to end-users and is typically owned by a single team. It’s common in bigger organizations to have 10+ teams owning separate systems that make up a larger super system. Since Level 1 diagrams are meant to focus on a single or few internal systems, this leads to a situation with many context diagrams and a lack of clarity on the broader architecture.
Context diagram bloat. This usually means you need a diagram that shows the bigger picture.
✅ The solution
The obvious solution is to put all the systems in a single context diagram. This is what the system landscape diagram is (commonly called a Level 0 diagram). It’s a supplementary diagram in the C4 model which sits above the context diagram and is scoped to the organization. Unlike the context diagram, which focuses on a single internal system, it focuses on multiple systems across the organization. Think of it as a large context diagram.
The system landscape diagram is a helpful entry point for viewers looking for a high-level architecture overview. From here, people can understand the different systems that comprise the ‘super system.’ They can then dive into specific context diagrams to explore systems that are relevant to them.
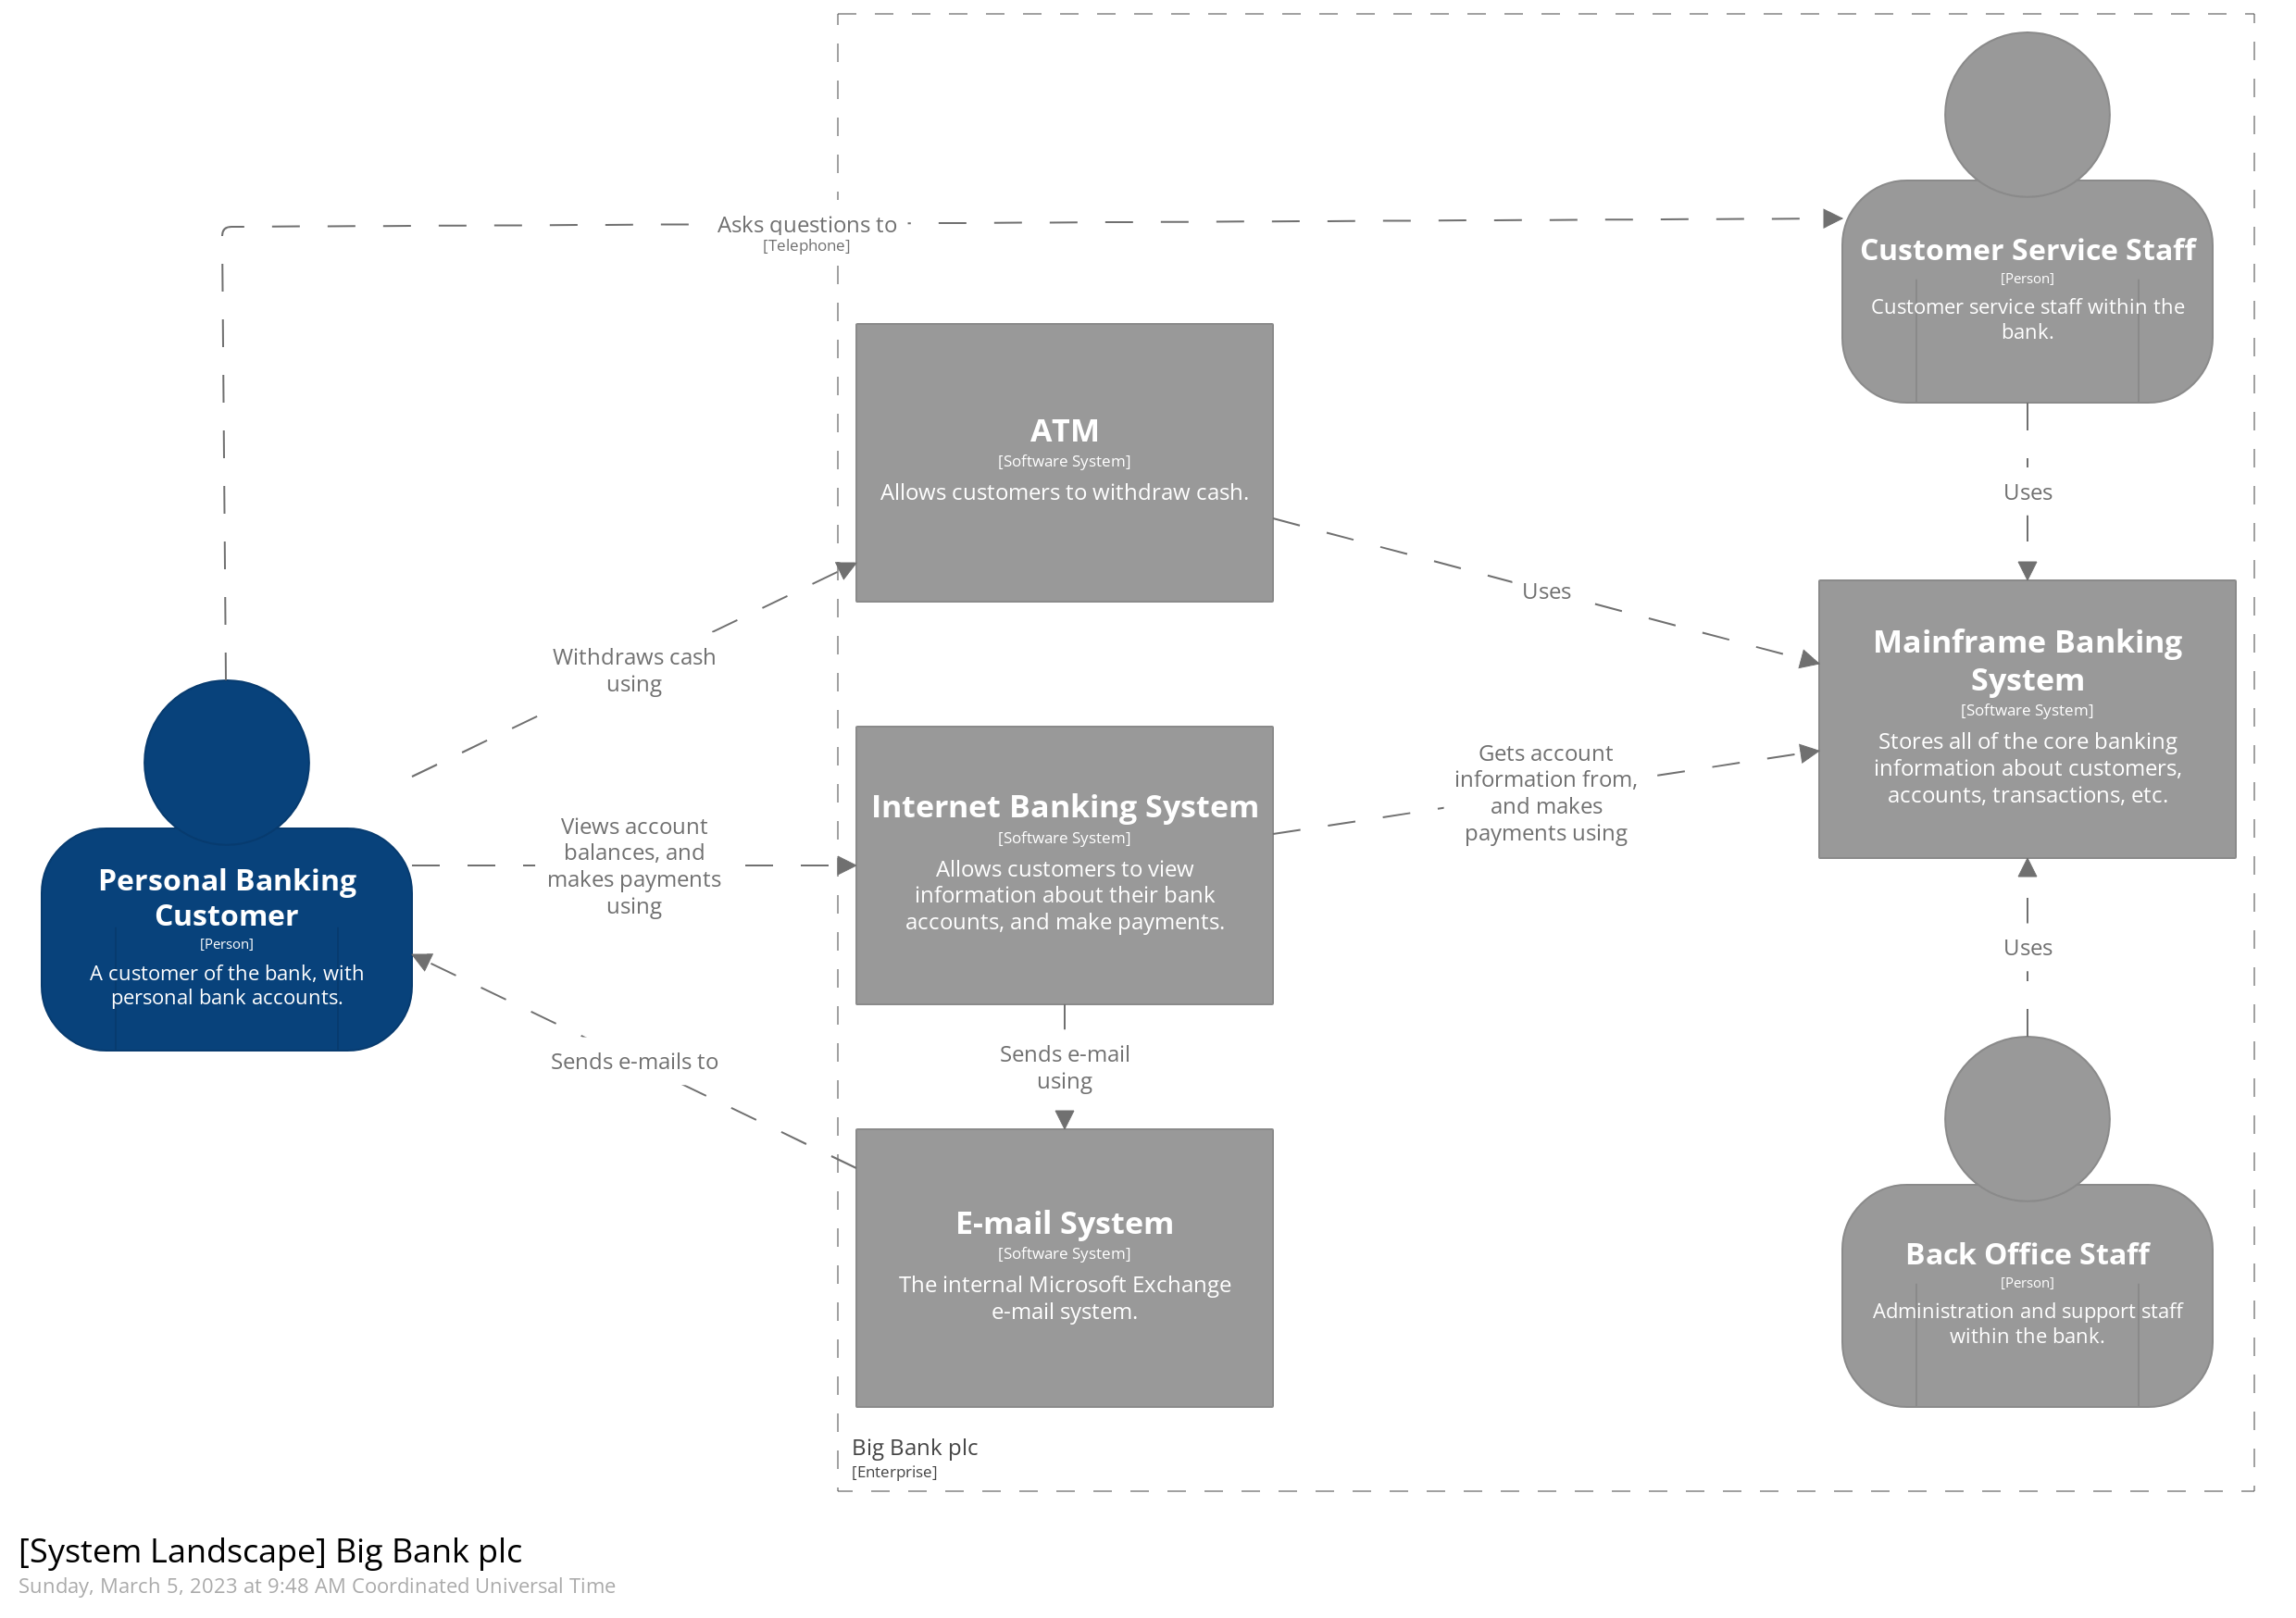
A system landscape diagram from the C4 model website.
In this example from the C4 model website, we see a larger bounded box representing the enterprise (Big Bank plc), with 4 systems and 2 actors inside. It’s easy to understand. However, as the enterprise grows and adds more systems (maybe Big Bank acquires several other banking systems that need to be connected), the landscape diagram will get bloated and complicated. In IcePanel, we solved this with Domains — a collection of systems in a common area, such as a business group or product area.
🧊 Creating a system landscape diagram in IcePanel
Plot twist: we decided not to create a dedicated system landscape diagram type (for now). Instead, we built Domains to group systems and diagrams based on business units or product areas. Domains allow you to separate systems into relevant groups while still being able to share model objects between them.
To create a system landscape diagram in IcePanel:
- First, create domains for each business or product area in your company.
- Create a Level 1 diagram with systems across all domains. To keep things organized, you can optionally create a company-wide domain for the landscape diagram.
- Use Groups or Tags to organize systems in the landscape diagram based on relevant categories (ex: hardware vs software systems).
- Create smaller Level 1 diagrams in each of the domains for every system.
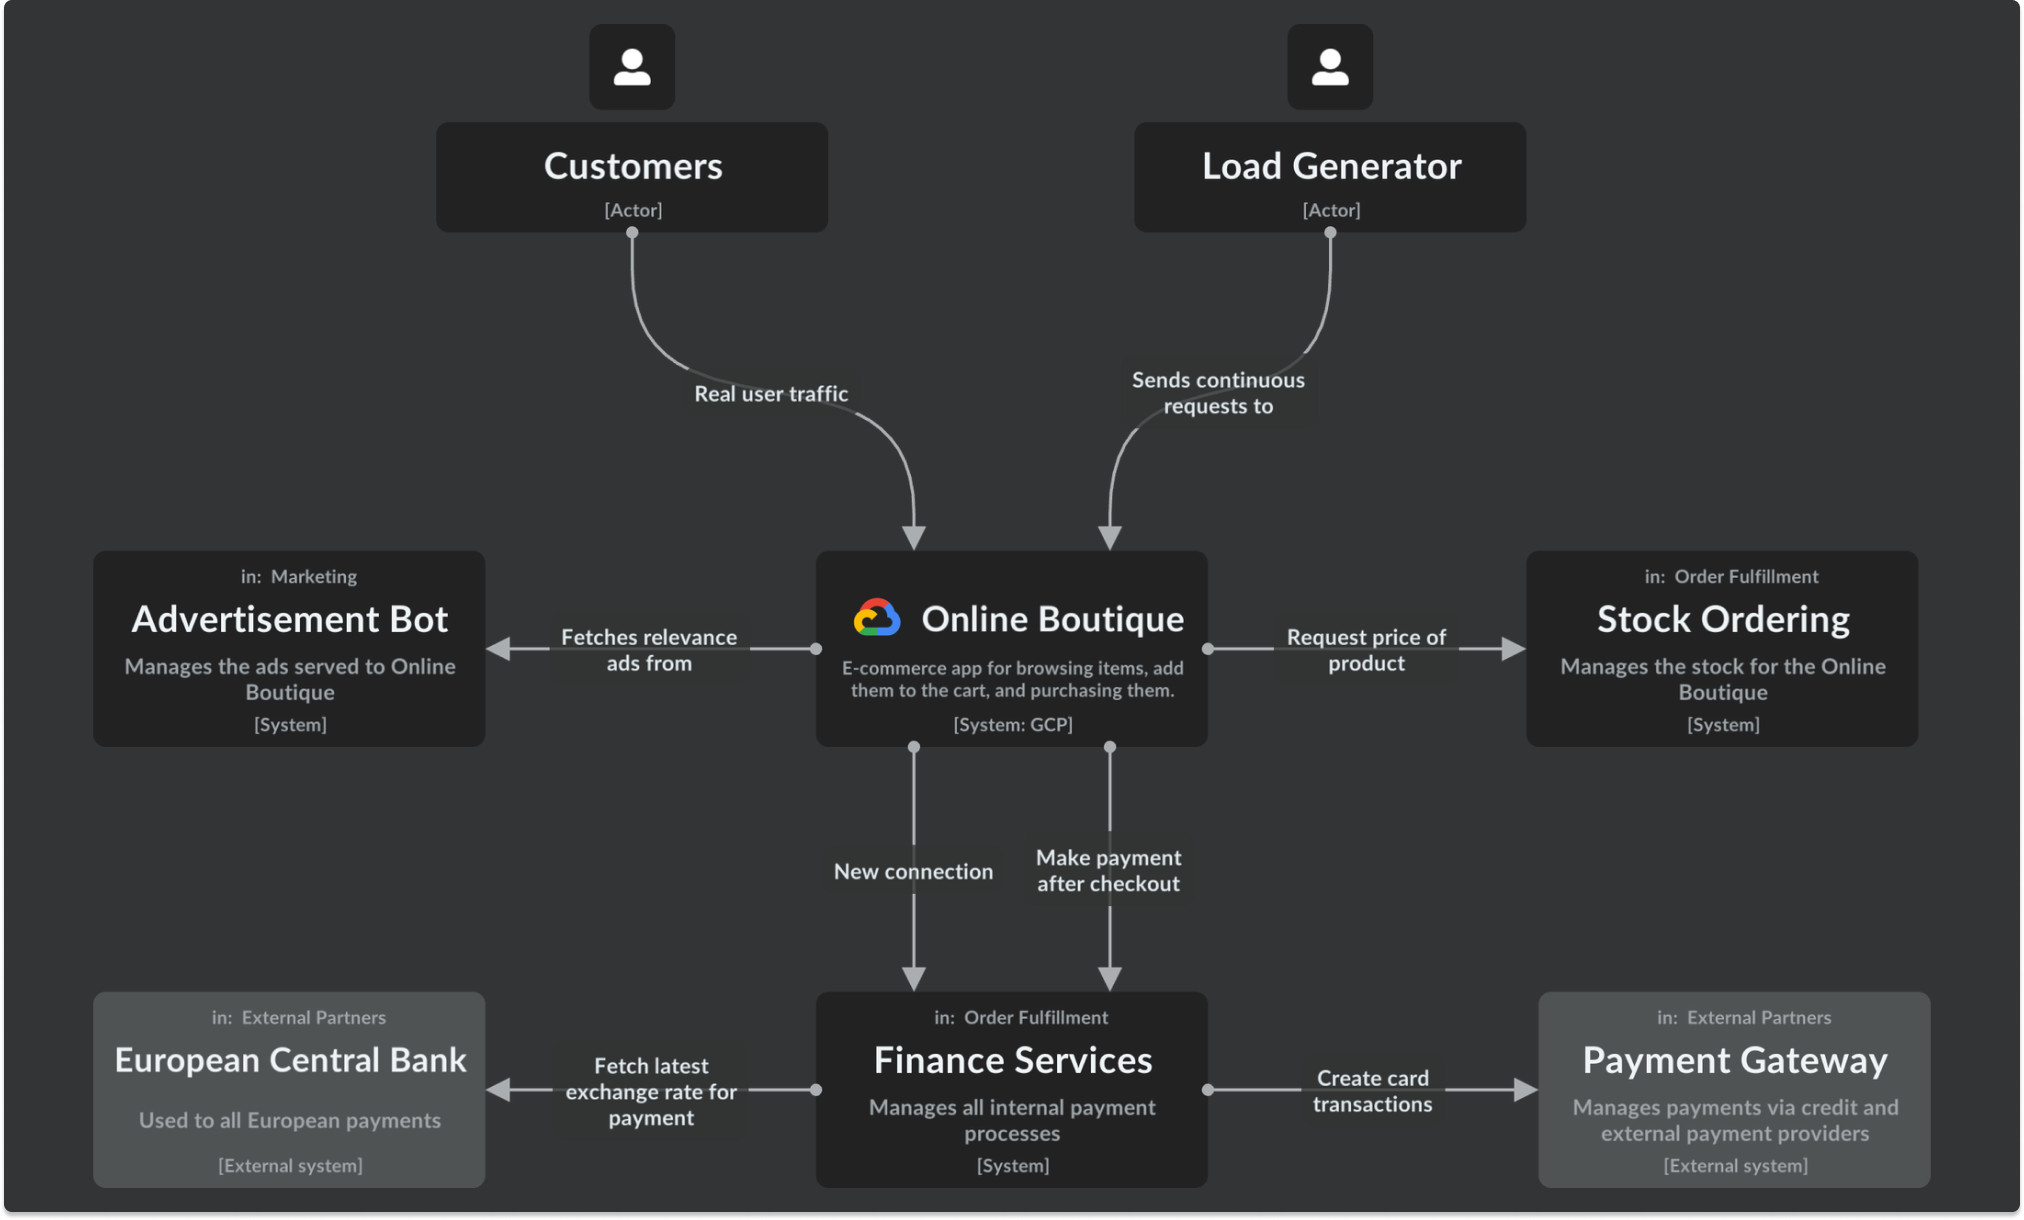
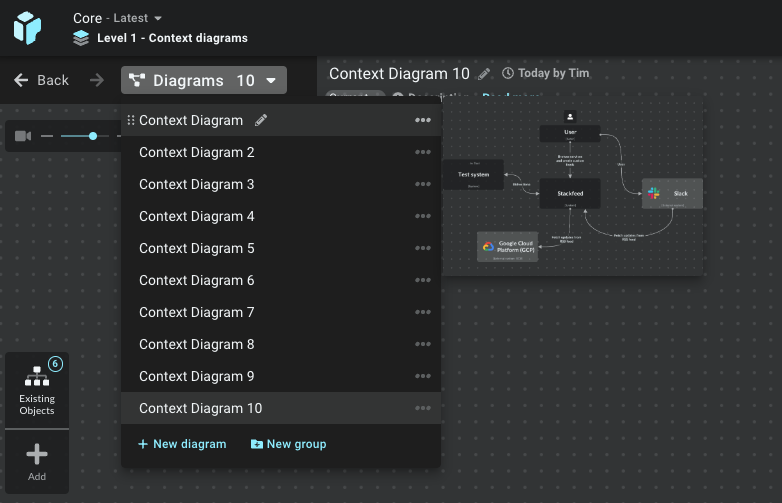
Landscape diagram with multiple systems across different domains. Objects belonging to other domains will have a domain label on the top.
We’re considering future improvements to show domains and their systems with a bounded box in a diagram, allowing you to see a top-level view of your big system. For now, you can optionally create a Group and add systems in the same domain. Follow our roadmap to stay up to date with what we’re releasing.
🏁 Next up
The system landscape diagram mainly solves the scalability problem of a large architecture. If you’re a smaller team with a simple architecture, this likely won’t be an issue, and you’ll be fine with Level 1 diagrams. However, regardless of your size, you may also want to show the physical deployment of your software. The core C4 diagrams aren’t meant to show this, which is where deployment diagrams come in. We’ll discuss this in our next guide. See you there! 👋
