
⚡️ TL;DR
- IcePanel and LucidChart are tools that can help you visualize your software architecture.
- IcePanel is easier to learn with a simple set of abstractions and a model-based system.
- LucidChart offers greater customization and importing options but encourages less consistency in design.
- Both tools offer rich collaboration tools, are secure, and have similar pricing. IcePanel allows you to purchase individual seats on the Growth plan with SSO.
🆚 Comparing IcePanel with LucidChart
IcePanel is a collaborative diagramming and modelling tool based on the C4 model. It’s best for consistently mapping software systems across teams for technical and non-technical audiences.
LucidChart is a general-purpose diagramming tool to visualize everything from business processes to organization charts and technical designs. Teams can collaborate on diagrams and share them across other tools.
Depending on what you’re looking for, IcePanel or LucidChart might be the right fit. In short, if you’re mainly looking to document your software architecture for the long term, IcePanel is the better option. If customization and speed are more important, LucidChart is a better fit. Let’s break down how both of these tools compare.
Audience
| Feature | IcePanel | LucidChart |
|---|---|---|
| Primary Users | Software architects and developers | Product managers, designers, marketers, business analysts, and developers |
| Secondary Users | Product managers, business analysts, and other non-technical audiences can view diagrams | All team members |
Primary use case
| Feature | IcePanel | LucidChart |
|---|---|---|
| Primary Use Case | Software architecture diagramming and modelling using the C4 model for complex systems | Flexible diagramming (flow charts, journey maps, org charts, UML, BPMN) and brainstorming |
🎓 IcePanel is simpler and easier to learn
Documentation isn’t fun (for most people), so an easy-to-use tool is paramount. Both tools offer a modern design with simple drag-and-drop interfaces. This makes them intuitive and easy to learn since they require no knowledge of syntax in other diagram-as-code tools.
However, IcePanel is built based on the C4 model, which has a simple set of abstractions and a hierarchy of diagrams. We believe that ‘less is more’ when it comes to documentation, so there are fewer options for shapes, colours, and line positioning than in LucidChart. There are also three diagram levels in IcePanel: Context, App (Container), and Component, whereas LucidChart has a larger collection of templates for different technical frameworks. You’ll need to browse and figure out which template is appropriate for your use case.
Overall, IcePanel is a simpler tool for documenting software architecture than LucidChart. Instead of deciding what notation and methodology to use, these decisions have already been made in IcePanel, so you can focus on the more important task of designing your architecture.
🌐 IcePanel encourages more consistent design
Diagrams are only helpful if people understand them, so consistent design is critical. It’s not about the quantity but the quality of the designs. Hundreds of diagrams with nuances in shapes, colours, and frameworks can quickly turn viewers off and cause them to lose trust in your documentation.
LucidChart offers a lot of flexibility and customization of diagrams. There are few limits to what you can create on LucidChart. If you’re craving to use bright neon green for boxes and purple lines, they won’t hold you back. They also have a large catalogue of different shapes and line types. The downside to this flexibility is that LucidChart doesn’t encourage consistent design. If the possibilities are endless, people will do anything (which sometimes leads to wildly inconsistent designs). Consistency requires a huge amount of governance.
IcePanel enforces consistency through the C4 model and its model-based system. There are a limited set of abstraction types (system, actor, app, store, component), 3 diagram levels, and objects are stored in a single source of truth (the model). Everyone has to follow these constraints, which leads to greater consistency.
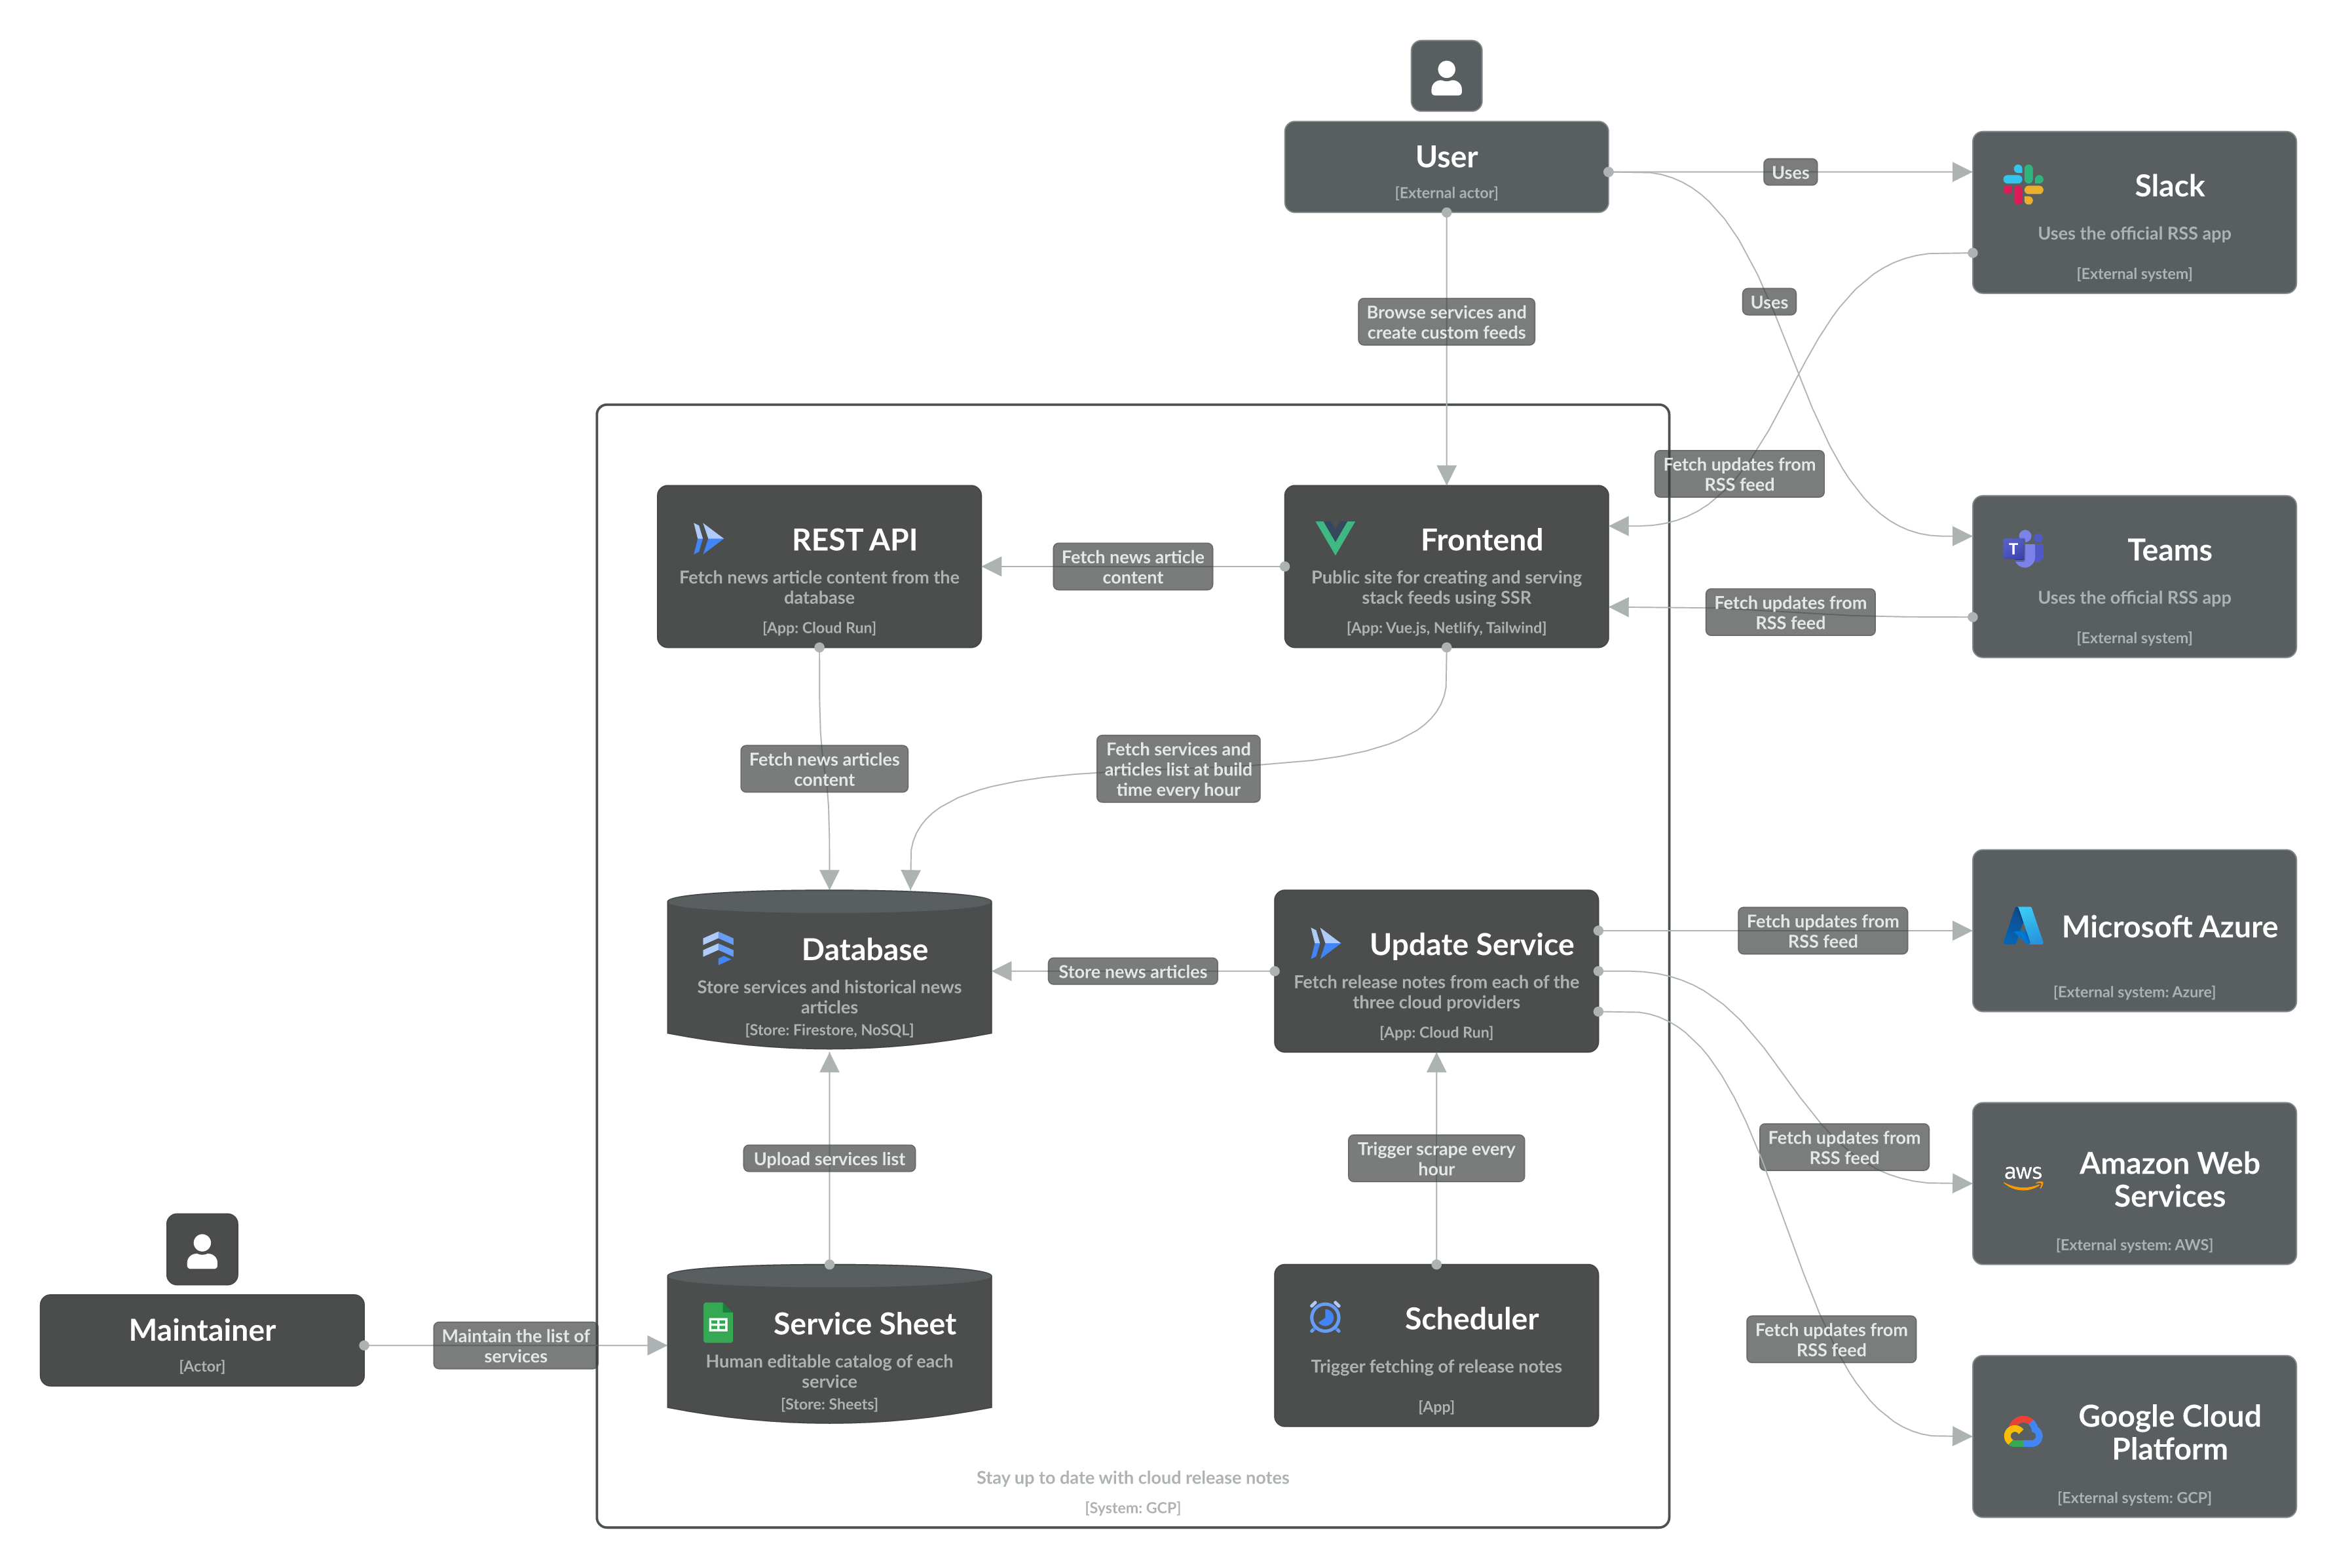
IcePanel Level 2 diagram
👥 Team collaboration
Architecture design is a team sport that’s rarely done in isolation. The more people involved, the more accurate the designs and the greater technical fluency across the organization. Both IcePanel and LucidChart come with several features to help you work together, outlined below:
| Feature | IcePanel | LucidChart |
|---|---|---|
| Commenting | 3 comment types (Question, inaccuracy, ideas) with mentioning | General commenting with mentioning |
| Share links | Read-only links with password protection or SSO-restricted access on Growth plans | Edit, comment, and read-only links, with password protection on Team plans |
| Revision history and versioning | Versions are created through an explicit user action. Users can create versions, view them in a timeline, and revert to a previous version | Versions are created implicitly based on user edits. Ability to revert to a previous version |
| Drafts | Ability to create drafts and merge them to the current state with a simple Git-like flow | Basic status property of a diagram |
| Embeds | Embed interactive diagrams using iFrames | Embed interactive diagrams using iFrames |
🔁 Importing and exporting
IcePanel and LucidChart support importing and exporting in multiple file formats. However, IcePanel has fewer importing options due to its model-based system.
| Feature | IcePanel | LucidChart |
|---|---|---|
| Importing | Model objects can be imported from Structurizr, Backstage, and a REST API | Supports importing from .csv, .xslx, .txt, SQL, and UML for specific diagram types |
| Exporting | PNG, PDF, SVG, JSON, CSV, HTML, Markdown, Structurizr, LLMs.txt, REST API | PNG, PDF, SVG, JPEG, JSON (only on LucidScale), CSV, REST API |
🔒 Security
IcePanel and LucidChart are both SOC 2 Type II and GDPR compliant. SSO is available on both tools but only for LucidChart Enterprise customers. IcePanel supports SSO on Growth and Isolation plans.
| Feature | IcePanel | LucidChart |
|---|---|---|
| Viewers | Viewers are free and unlimited on all plans | Limited-access users only on Enterprise |
| SSO | Available on Growth plans | Only available on Enterprise plans |
| Compliance | SOC 2 Type II, GDPR | SOC 2 Type II, GDPR, PCI, FedRAMP |
💰 Pricing
Both IcePanel and LucidChart charge per editor on monthly or annual plans. At IcePanel, we believe in transparent and straightforward pricing. We don’t like to overcomplicate things with forced seat bundles or add-ons.
Although IcePanel’s per-editor-seat price is higher than LucidChart’s, you can purchase as many seats as you need.
| Feature | IcePanel | LucidChart |
|---|---|---|
| Monthly plan | $50/editor/mo for Growth | $11/editor (minimum purchase of 3 seats, which increments to 5, 10, 15, 20, etc.) |
| Annual plan | $40/editor/mo for Growth | $9/editor/month (18% discount, minimum purchase of 3 seats) |
| Enterprise pricing | $80/editor/mo (minimum 20 seats). Optional isolated single-tenant add-on for $4,000/mo | $21.99/editor on monthly plans, $18.25/editor/month on annual plans (minimum purchase of 2 seats) |
🏁 To wrap up
IcePanel and LucidChart are two options for documenting software architecture. IcePanel is a better fit if you’re mainly looking for an easy-to-use tool that promotes consistent diagramming with a single source of truth. Pricing for IcePanel is slightly higher than LucidChart for Growth/Team plans. However, it’s much more flexible with single-seat purchases and SSO on the Growth plan.
