1. Draw.io (diagrams.net)
- Started in 2000
- Similar to LucidChart and Visio
- Pricing: Free (open-source), but paid on Atlassian after 10+ users
- Best for small to medium-sized teams on the free option. Good for large teams on Atlassian
What is Draw.io?
Draw.io is an open-source diagramming tool with a drag-and-drop UI and an extensive shape library, allowing you to create different types of architecture diagrams. The company’s mission is to “provide free, high quality diagramming software for everyone.” Using the open-source version allows you to freely create, edit, and save diagrams in your preferred workspace.
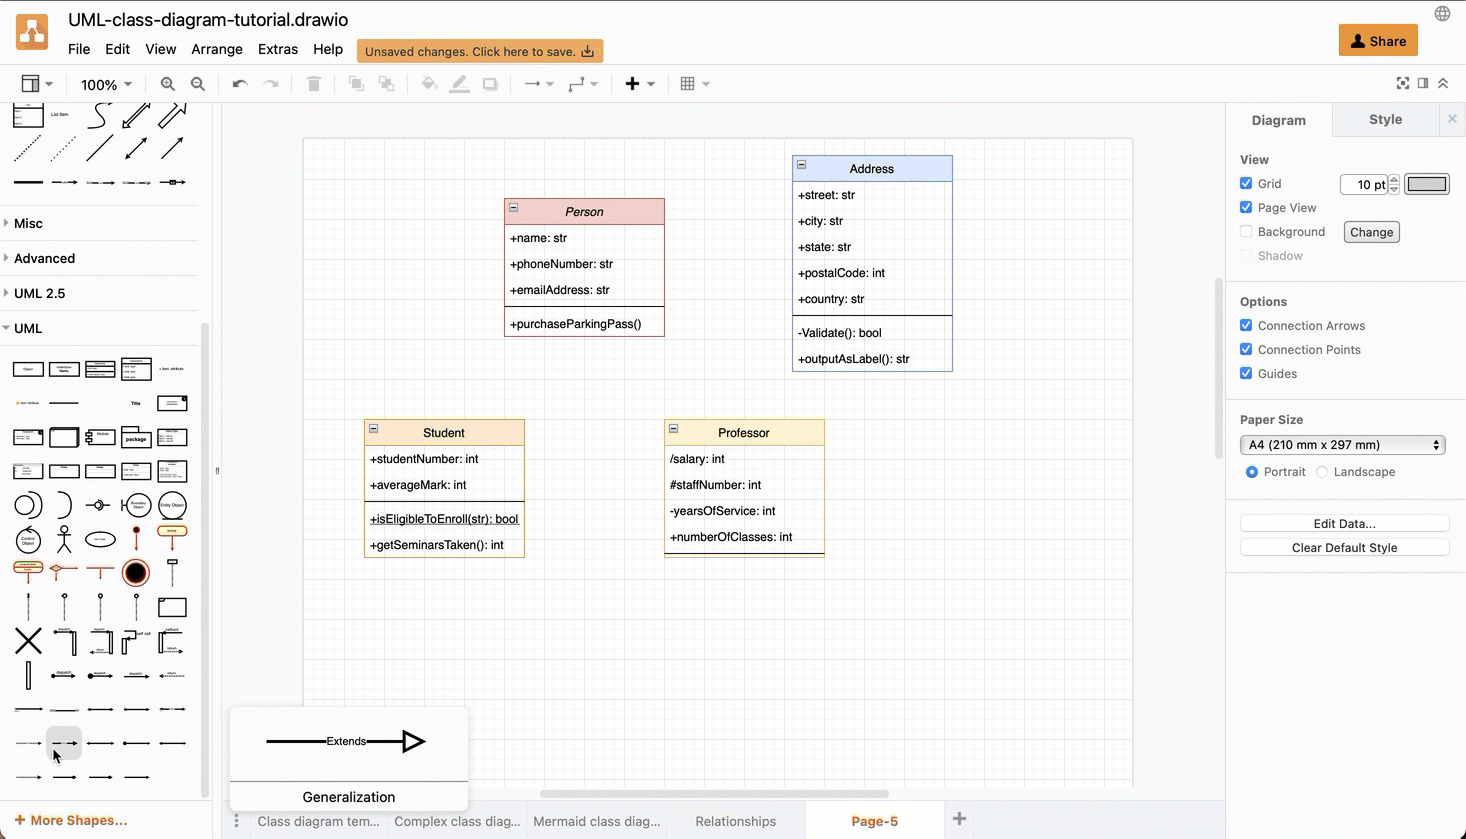
Draw.io UML class diagrams
Main features
- 🖌️ Intuitive drag-and-drop editor with customization options.
- 📦 Flexible diagram storage. Diagrams can be saved in Google Drive, Microsoft OneDrive, or locally on the desktop app.
- 🤝 Atlassian (Confluence and JIRA) integration. Work directly in the tool without leaving.
- 👥 Real-time collaboration with commenting.
How does Draw.io compare to LucidChart?
| Aspect | Draw.io | LucidChart |
|---|---|---|
| Pricing | ✅ Generous free option | 🔴 Paid plans required for advanced features |
| Shape libraries | ✅ Extensive shape libraries to create many different types of architecture diagrams (UML, C4) | ✅ Good selection of shapes and templates |
| Integrations | ✅ Integrates with Google Drive, OneDrive, GitHub, Confluence, and Notion | ✅ More enterprise integrations (ServiceNow, LeanIX) |
| UI/UX | 🔴 Less modern UI than LucidChart | ✅ Modern, polished interface |
| Collaboration | 🔴 More limited collaboration features (no revision history, versioning) | ✅ Advanced collaboration with revision history |
| Enterprise features | 🔴 Not as many enterprise integrations compared to LucidChart | ✅ Comprehensive enterprise integration suite |
Best for: Teams wanting a free, versatile diagramming tool that can be saved in their existing workspace. Also great for teams working in Confluence or JIRA who want something that feels native.
2. Mermaid.js
- Started in 2015
- Similar to PlantUML and Terrastruct
- Pricing: Free (open-source)
- Best for small to medium-sized technical teams
What is Mermaid.js?
Mermaid.js is a diagram-as-code tool that lets you create diagrams using markdown-style syntax. Mermaid was created to eliminate ‘doc-rot.’ Documentation and diagramming take a lot of time and get outdated quickly, but are essential artifacts for learning and planning. Mermaid was built to make diagramming easier and more embedded with existing dev tools.
Main features
- 🤖 Markdown-style syntax with a live editor
- 📊 Support for many diagram types (UML, Gantt, C4 model, mind maps, charts)
- 🌐 Embed into existing documentation or websites
sequenceDiagram
    Consumer-->API: Book something
    API-->BookingService: Start booking process
    break when the booking process fails
        API-->Consumer: show failure
    end
    API-->BillingService: Start billing process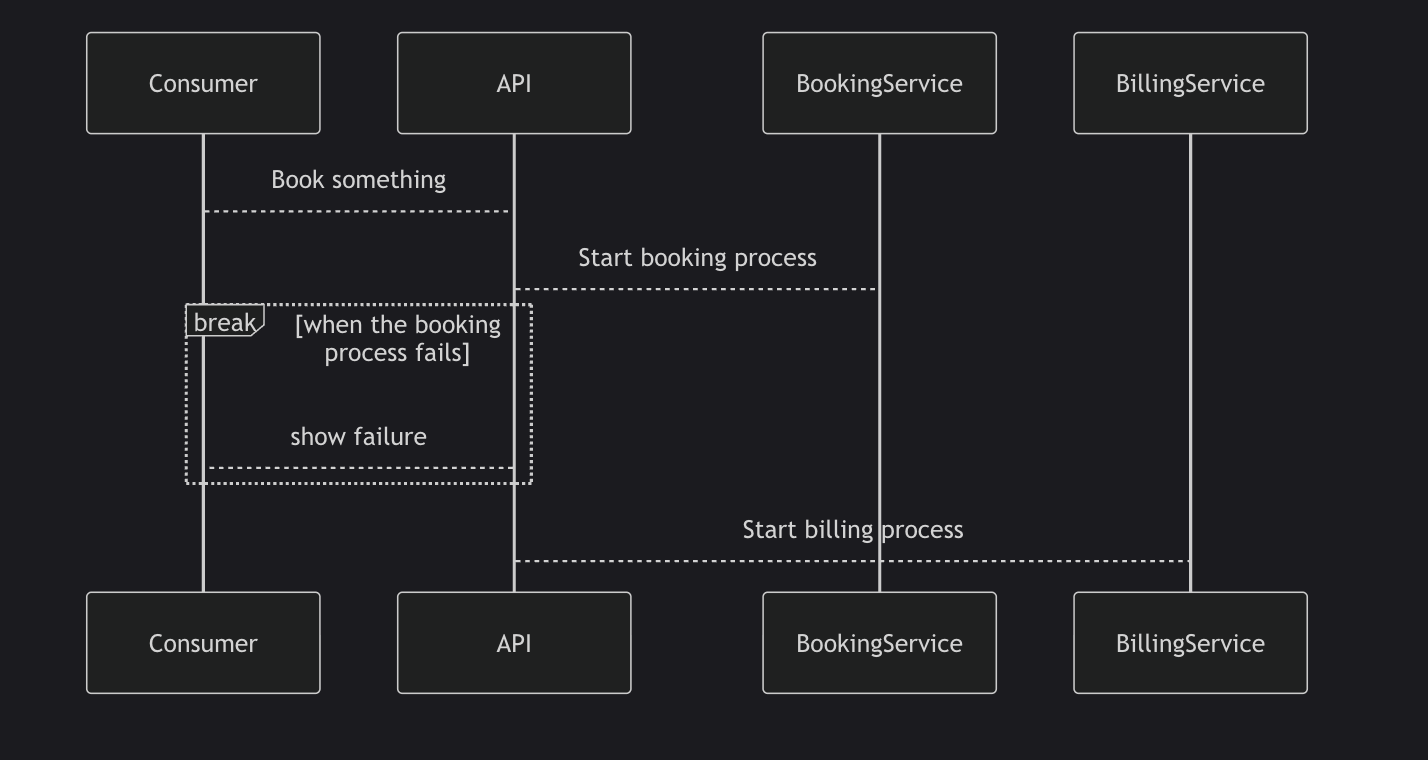
Sequence diagram example in Mermaid.js
How does Mermaid.js compare to LucidChart?
| Aspect | Mermaid.js | LucidChart |
|---|---|---|
| Versioning & automation | ✅ Diagram-as-code allows for versioning and automation | 🔴 Manual diagram creation and updates |
| Documentation | ✅ Excellent documentation that’s well-maintained | ✅ Good documentation and tutorials |
| Developer integrations | ✅ Native integrations with Azure DevOps, GitHub, GitLab, and many other tools | ✅ Some developer tool integrations |
| Learning curve | 🔴 Requires learning the syntax | ✅ Visual drag-and-drop interface |
| Styling & layout | 🔴 Less styling and layout options compared to visual tools | ✅ Extensive styling and customization options |
| Non-technical users | 🔴 Not ideal for non-technical users | ✅ Accessible to non-technical team members |
Best for: Developers and architects who prefer working with code and want diagrams versioned, automated, and integrated with their CI/CD workflow.
3. IcePanel
- Started in 2021
- Similar to LucidChart and Miro
- Pricing: Free and paid options ($40/mo/editor annually)
- Best for medium to large teams
What is IcePanel?
IcePanel is a collaborative diagramming and modelling tool based on the C4 model. It allows you to create hierarchical diagrams while maintaining a single source of truth in a model. IcePanel is a lightweight tool that helps teams design software architecture at scale and with structure and consistency.
Main features
- 🔢 C4 model diagrams (Level 1 to Level 3)
- 🔀 Communicate user journeys with Flows and Tags
- 🧱 Maintain and reuse objects with a model
- 💡 Collaborate on ideas in Drafts and track changes with Versions
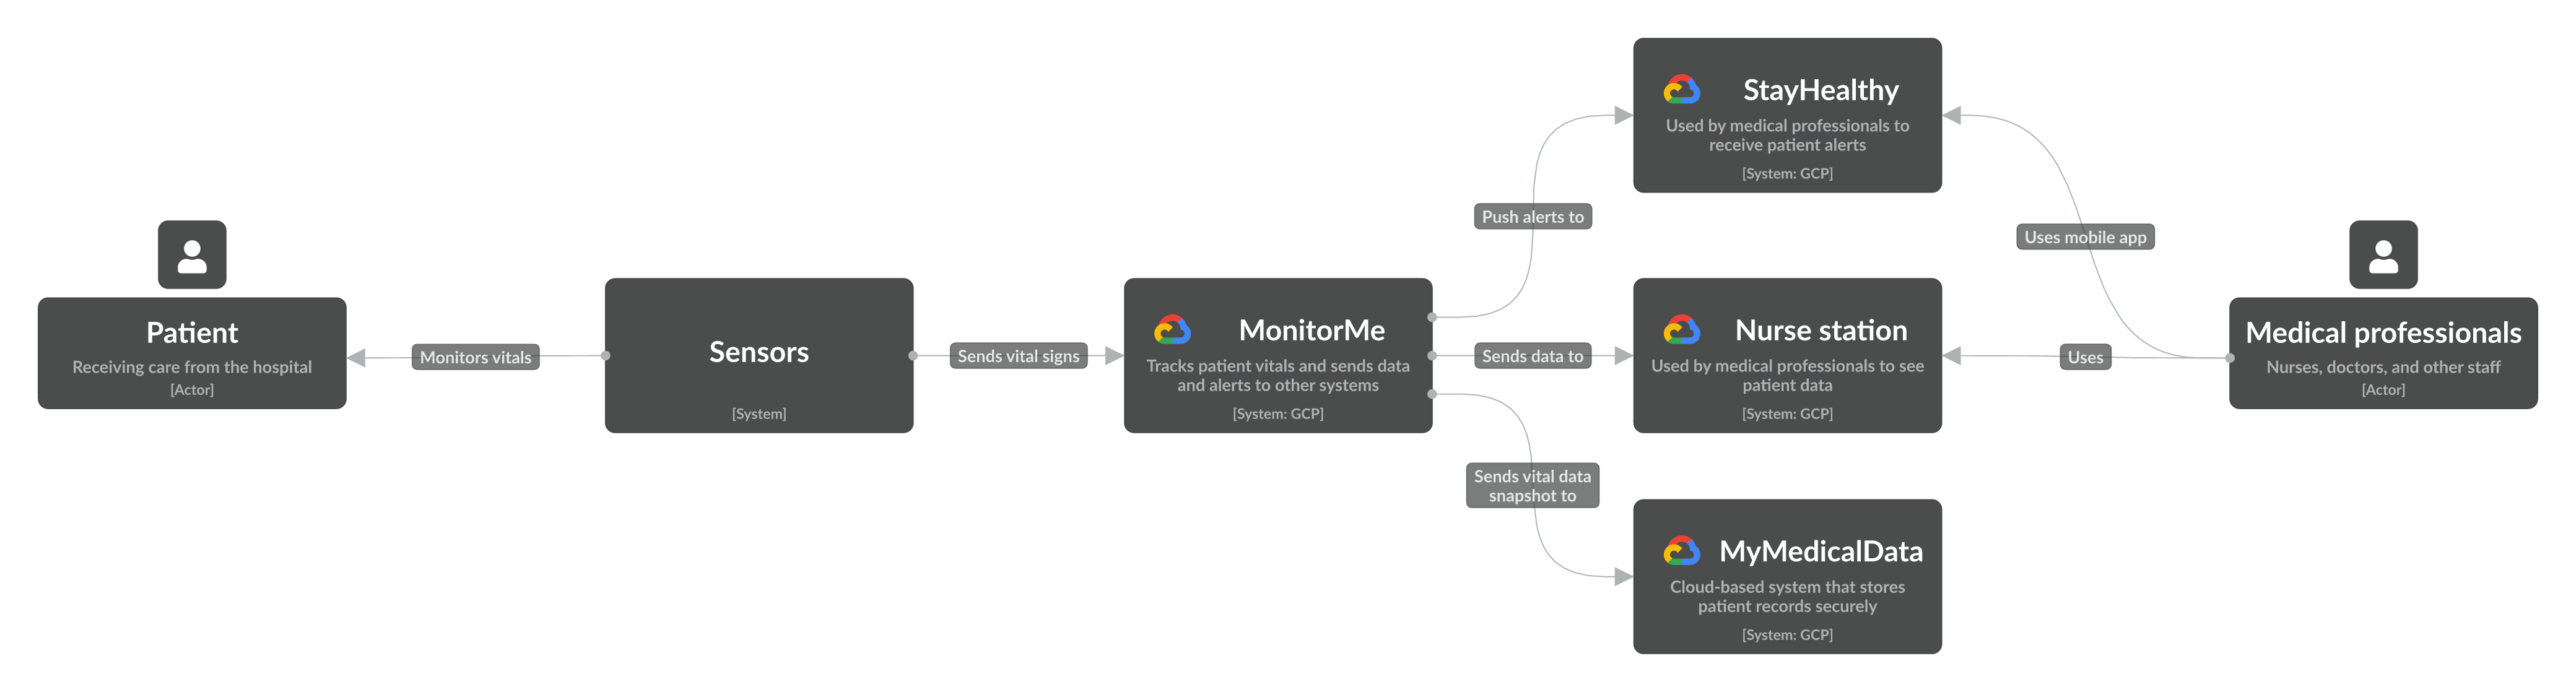
Level 1 Context Diagram in IcePanel
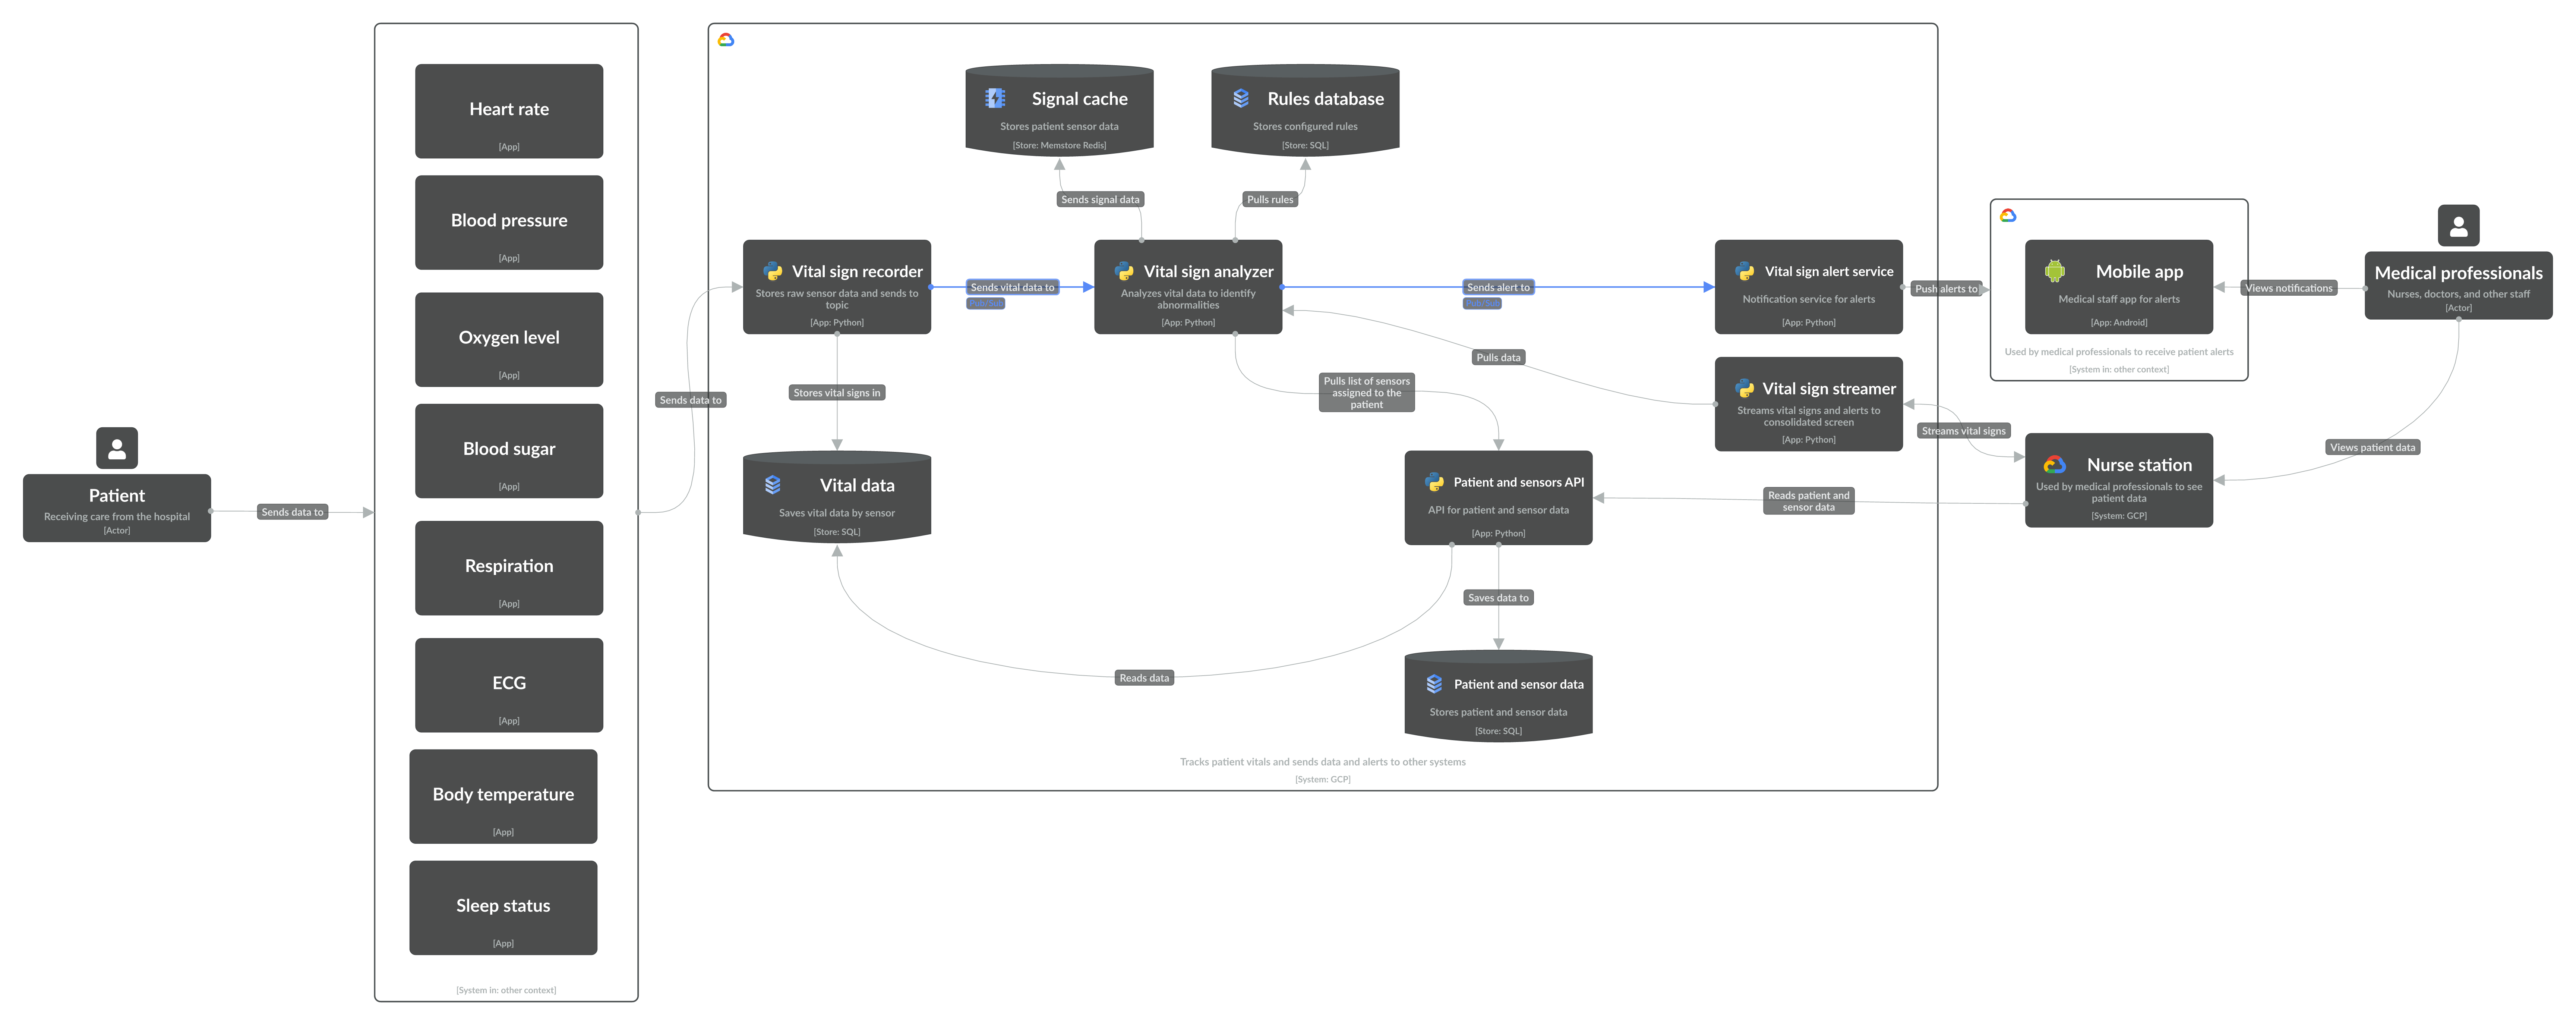
Level 2 App Diagram in IcePanel
How does IcePanel compare to LucidChart?
| Aspect | IcePanel | LucidChart |
|---|---|---|
| C4 model support | ✅ Built-in C4 model support | 🔴 No native C4 model support |
| UI/UX | ✅ Simple drag-and-drop UI | ✅ Modern, intuitive interface |
| Data management | ✅ Model-based (single source of truth) | 🔴 Separate diagrams, no unified model |
| Collaboration | ✅ Collaboration focused (Flows, share links, commenting) | ✅ Advanced collaboration features |
| Specialization | ✅ More specialized than general diagramming tools (best for software architecture) | ✅ General-purpose diagramming tool |
| Learning curve | 🔴 Learning curve to map the C4 model to your software architecture | ✅ Easy to learn for various diagram types |
| Layout flexibility | 🔴 Less layout flexibility compared to LucidChart | ✅ Extensive layout and customization options |
Best for: Teams that want to consistently design and document their software architecture without the complexity of learning a new syntax.
4. PlantUML
- Started in 2009
- Similar to Mermaid.js and GraphViz
- Pricing: Free (open-source)
- Best for small to medium-sized teams
What is PlantUML?
PlantUML is another diagram-as-code tool that specializes in UML diagrams with its own domain-specific language (DSL). It also supports non-UML diagrams, like BPMN, C4 model, ERD, and mind maps. PlantUML has been around for a while and still has a loyal following. According to Google Trends, it’s still much more popular than the ‘C4 model’ with an active forum.
Main features
- 🤖 DSL to create UML and other diagrams (BPMN, C4 model, ERD)
- 🖥️ Local version option
- 🔁 Integrations with IDEs and some layout customization options
@startuml
class Student {
  Name
}
Student "0..*" -- "1..*" Course
(Student, Course) . Enrollment

class Enrollment {
  drop()
  cancel()
}
@enduml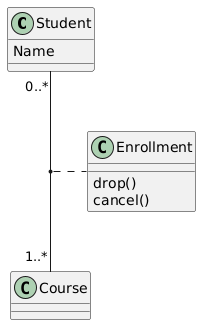
PlantUML class diagram
How does PlantUML compare to LucidChart?
| Aspect | PlantUML | LucidChart |
|---|---|---|
| UML support | ✅ Comprehensive UML diagram support | ✅ Good UML diagram support |
| IDE integrations | ✅ IDE integrations available (VSCode, IntelliJ, Atom) | 🔴 Limited IDE integrations |
| Versioning & automation | ✅ Diagram-as-code allows for versioning and automation | 🔴 Manual diagram creation and updates |
| Learning curve | 🔴 Steeper learning curve (has its own DSL) | ✅ Visual drag-and-drop interface |
| Visual customization | 🔴 Limited visual customization options | ✅ Extensive styling and customization options |
| Collaboration | 🔴 Limited collaboration options | ✅ Advanced collaboration features |
| Documentation | 🔴 Very cumbersome documentation (website has popup ads 🫠) | ✅ Good documentation and tutorials |
| Updates | 🔴 Local version requires manual updates | ✅ Automatic updates in cloud version |
Best for: Architects and developers needing UML-specific documentation with the benefits of diagram-as-code.
5. Microsoft Visio
- Started in 1992
- Similar to LucidChart and Draw.io
- Pricing: Starts at $5/user standalone on cloud. Included in Microsoft 365
- Best for medium to large teams
Main features
- 🖌️ Drag-and-drop UI with a similar feel to other Microsoft Office products
- 📋 Templates to create business and software architecture diagrams
- 👥 Real-time collaboration within the Microsoft ecosystem
- 🔒 Enterprise-level security and compliance
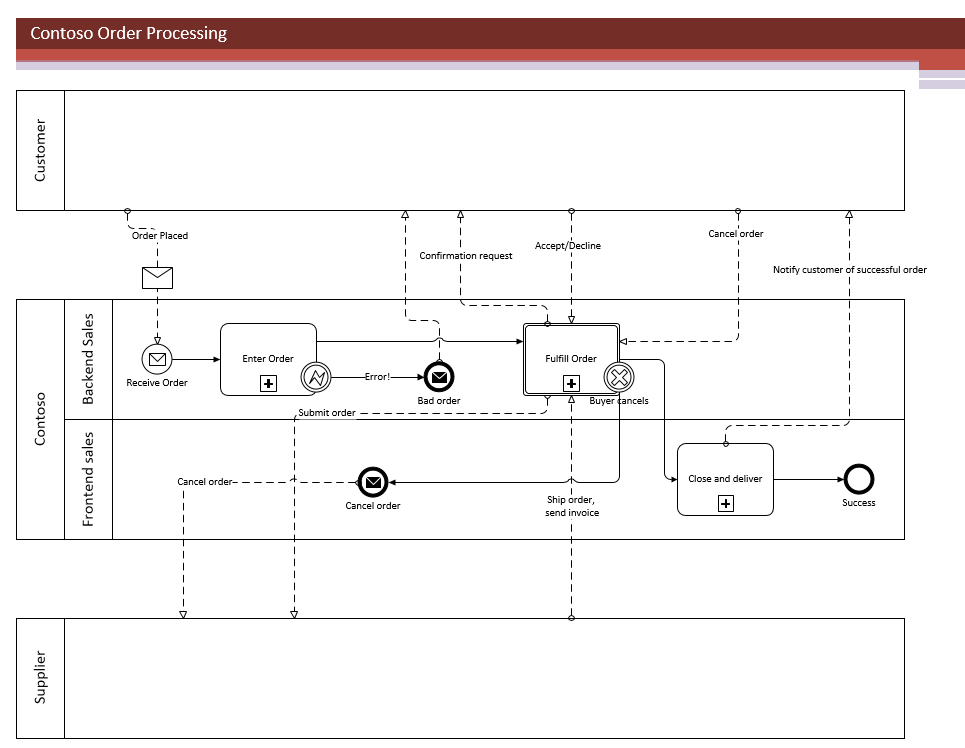
Visio BPMN example
How does Visio compare to LucidChart?
| Aspect | Microsoft Visio | LucidChart |
|---|---|---|
| Microsoft 365 integration | ✅ Deep integration with Microsoft 365 | 🔴 No Microsoft 365 integration |
| Template library | ✅ Rich template library for a variety of diagram types | ✅ Good selection of templates |
| Data linking | ✅ Advanced data linking capabilities | ✅ Some data linking features |
| Ease of use | 🔴 Harder to use than LucidChart | ✅ Modern, intuitive interface |
| Platform compatibility | 🔴 Locked into the Windows ecosystem with limited integrations | ✅ Cross-platform web-based solution |
| Maintenance & development | 🔴 Not as actively maintained or developed compared to other Microsoft products | ✅ Actively maintained and regularly updated |
Best for: Teams that are already invested in the Microsoft ecosystem and need some basic software diagrams.
Choosing the right alternative
Ultimately, the right tool for you depends on your needs, budget, and team’s willingness to learn a new tool.
- If you’re constrained by budget, Draw.io or Mermaid.js offer free solutions.
- If you want to automate and version your diagrams, try Mermaid.js or PlantUML.
- If you want a lightweight tool that’s easier to maintain and structure, try IcePanel.
- If your team is already heavily using Atlassian or Microsoft products, Draw.io or Visio are good options.
Any tools that we missed? Let us know!
Stay Chill 🤙
