
🤔 Why did we do this?
Every year, we ask the community to share their thoughts and opinions shaping software architecture. Check out the 2024 results here. Looking back, 2025 was a year of rapid change and continued AI adoption. Interest in AI continued to diffuse, extending into more industries and more complex workflows. How do architects feel about all of this? How has it impacted their day-to-day? We were curious to find out.
We’re excited to share the results from our 2025 survey. Let’s dive in!
🔑 Key highlights
Read this section if you want the TL;DR, or scroll down and look for a detailed breakdown of each section.
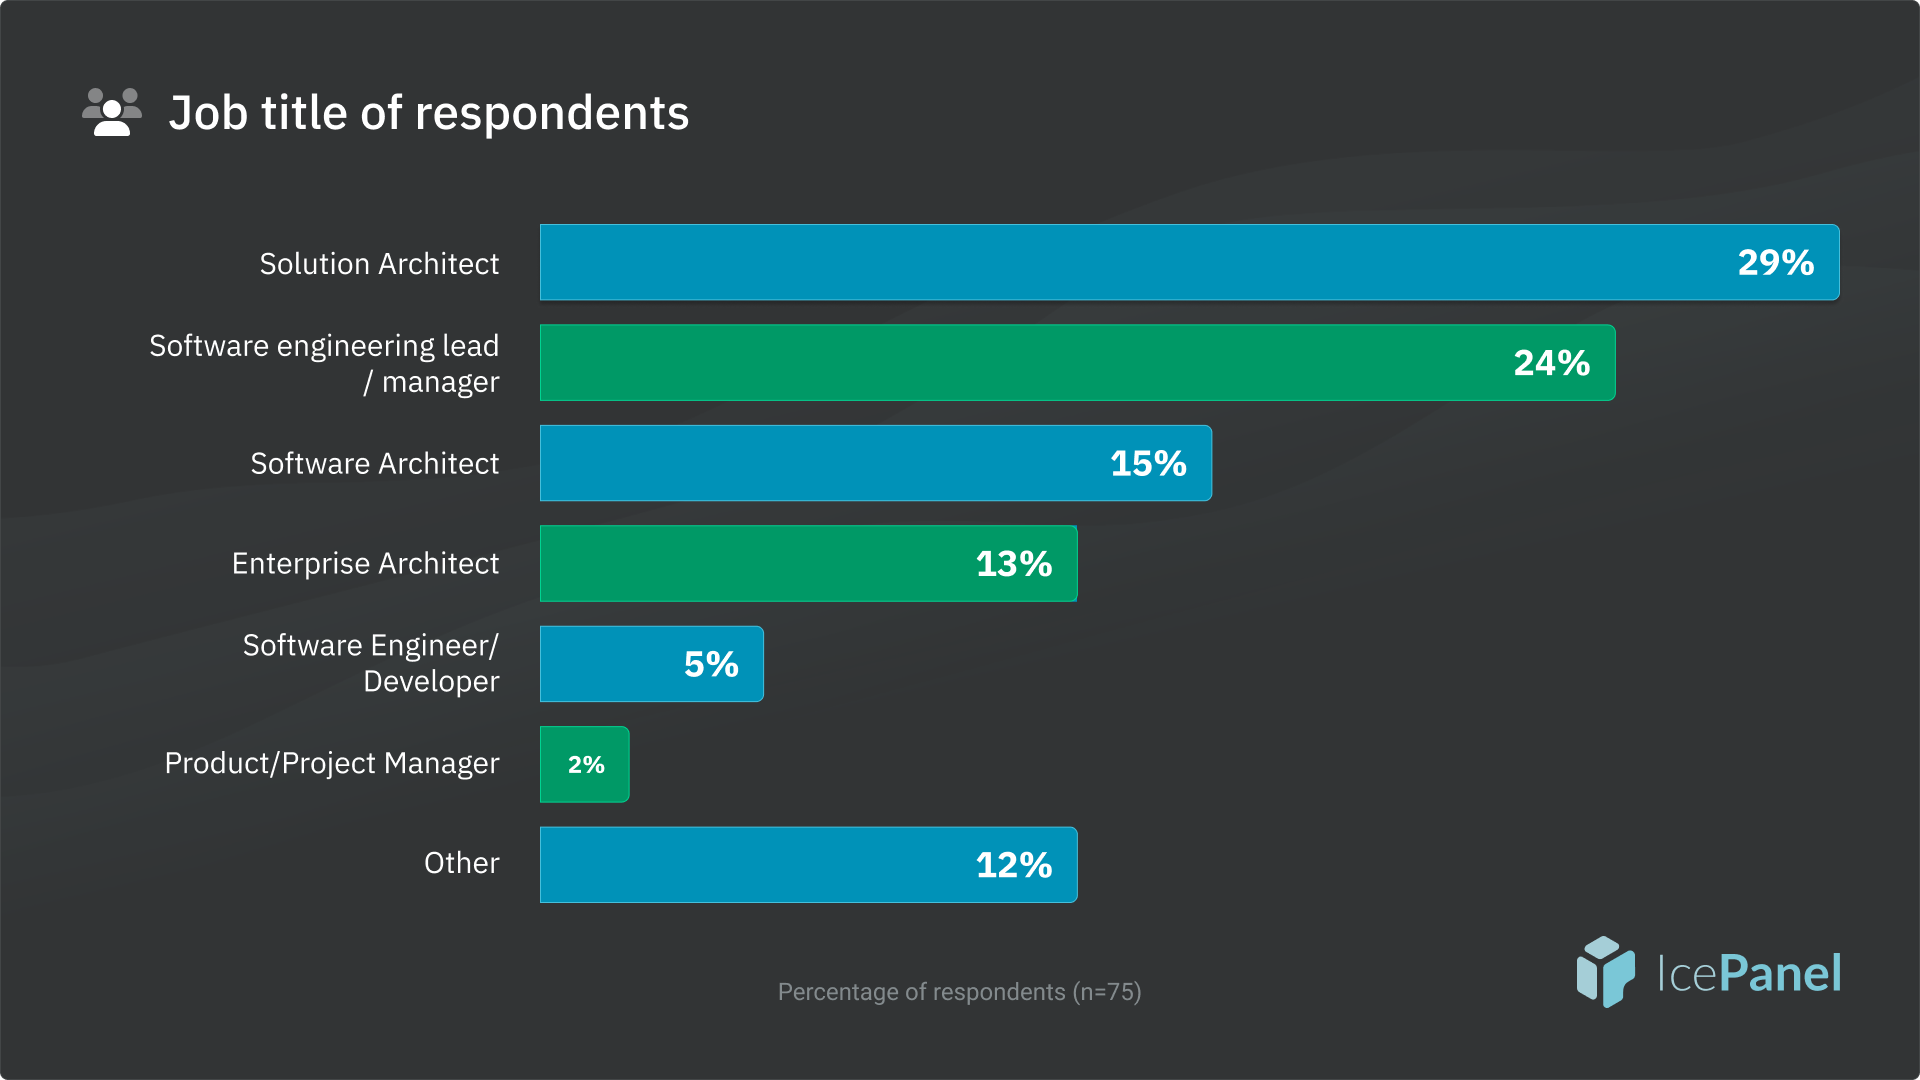
- 75 people responded, with 57% being architects and 29% engineers/developers.
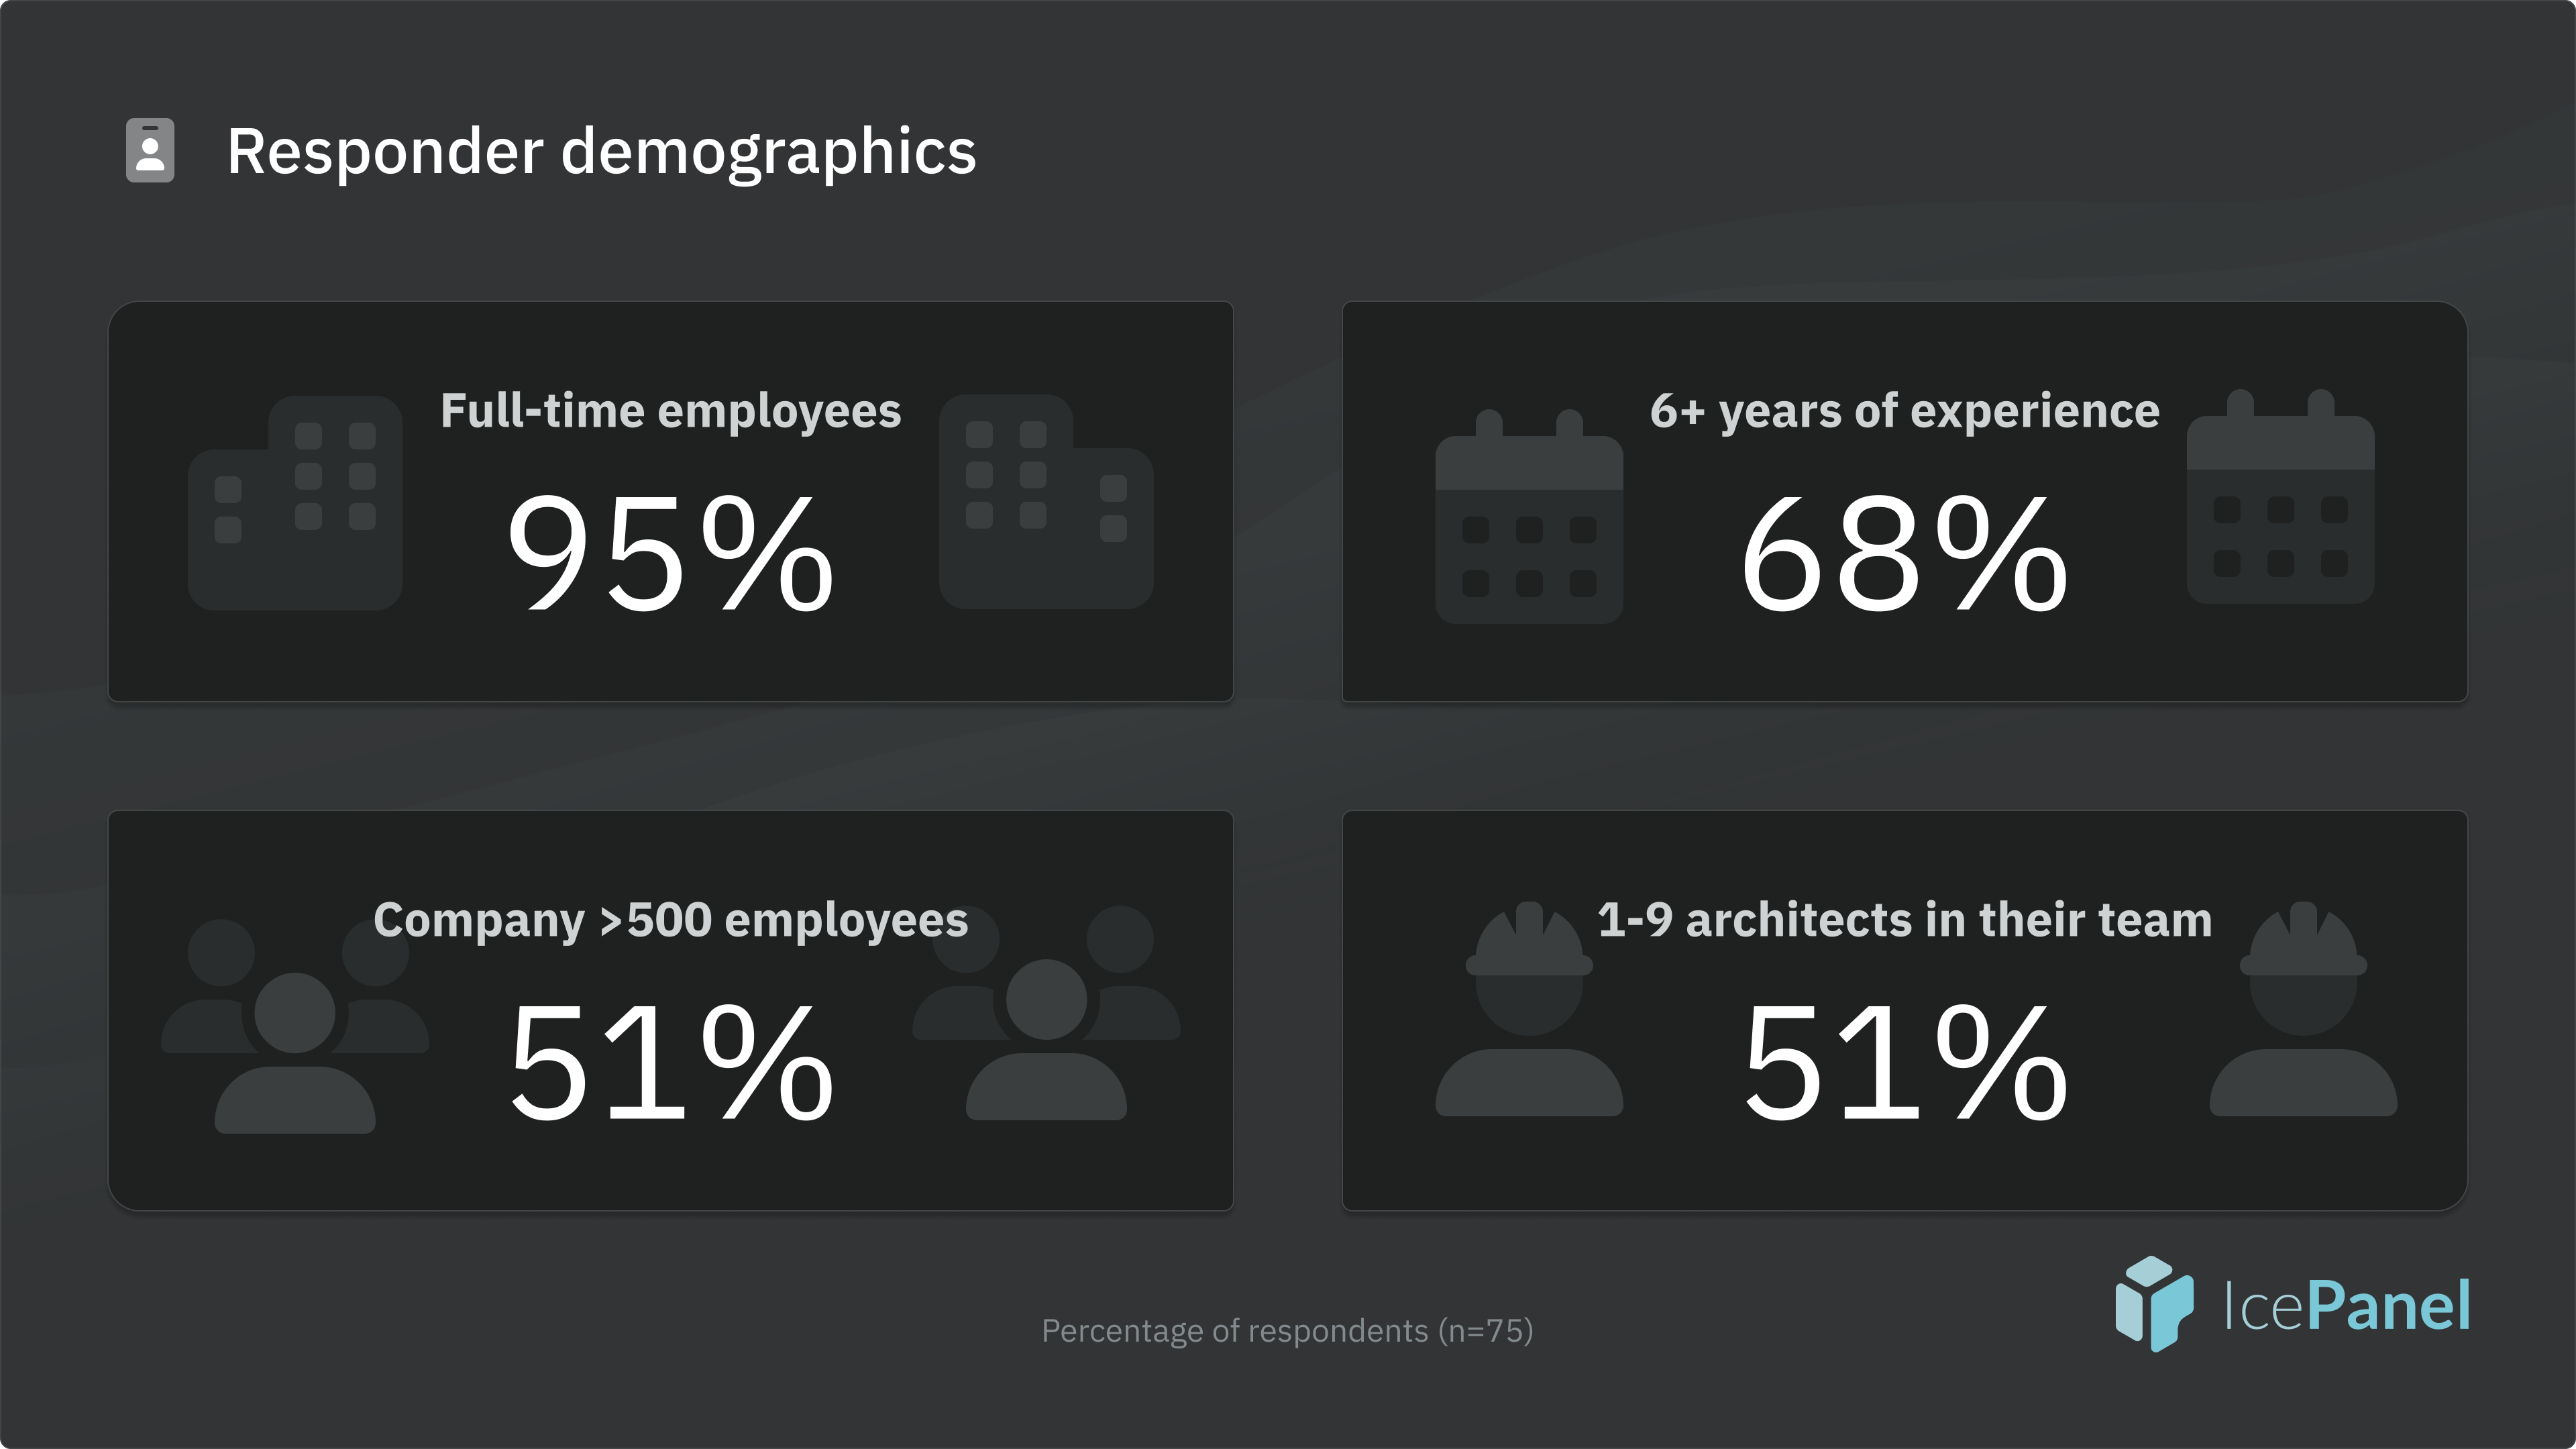
- Most respondents were experienced professionals, with 95% being full-time employees. 68% had 6+ years of experience.
- Keeping documentation up to date was overwhelmingly the biggest challenge, followed by lack of standards and finding the right level of detail.
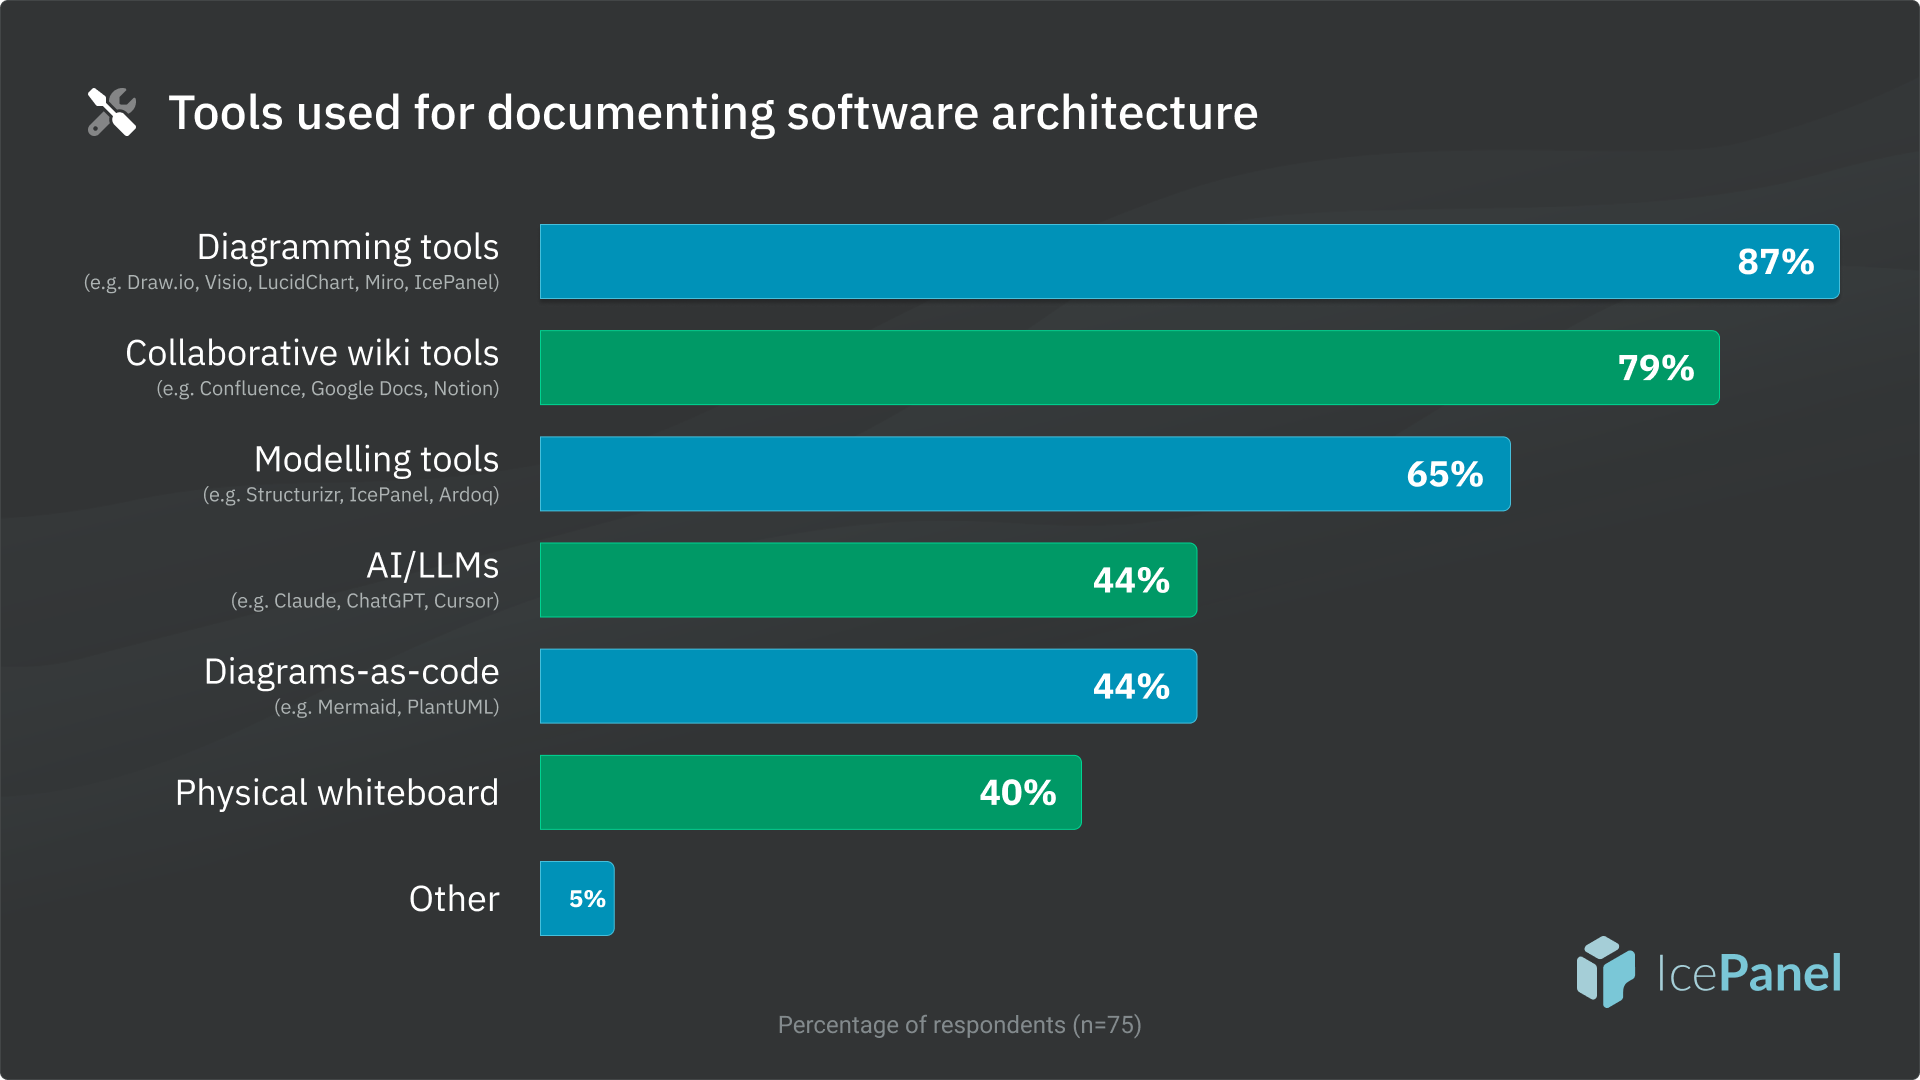
- Diagramming tools (87%) and collaborative wikis (79%) were the most popular tools for software architecture. 44% now use AI/LLMs for documentation.
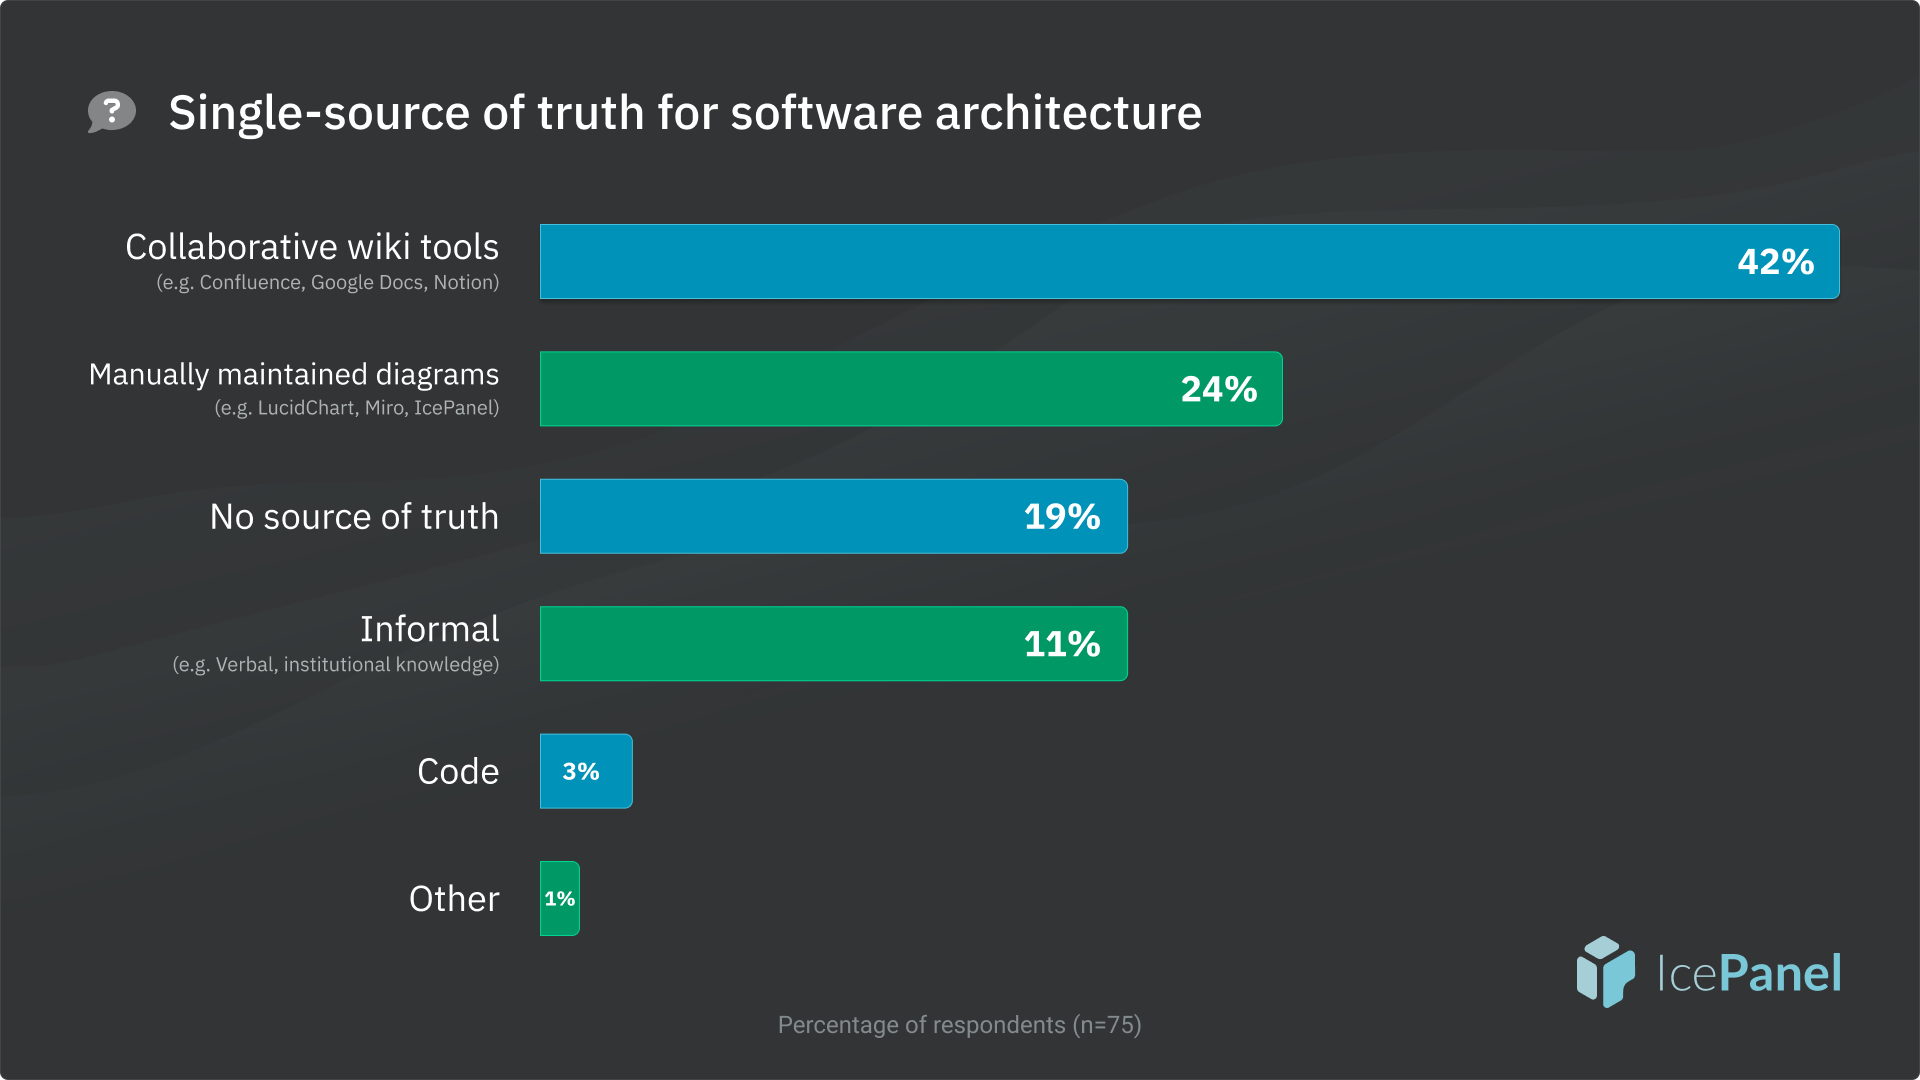
- Source of truth shifted to collaborative wikis (42%), followed by dedicated tools (24%).
- More than 70% were at least moderately confident using the C4 model. Context diagrams (81%) and Container diagrams (79%) were most commonly used.
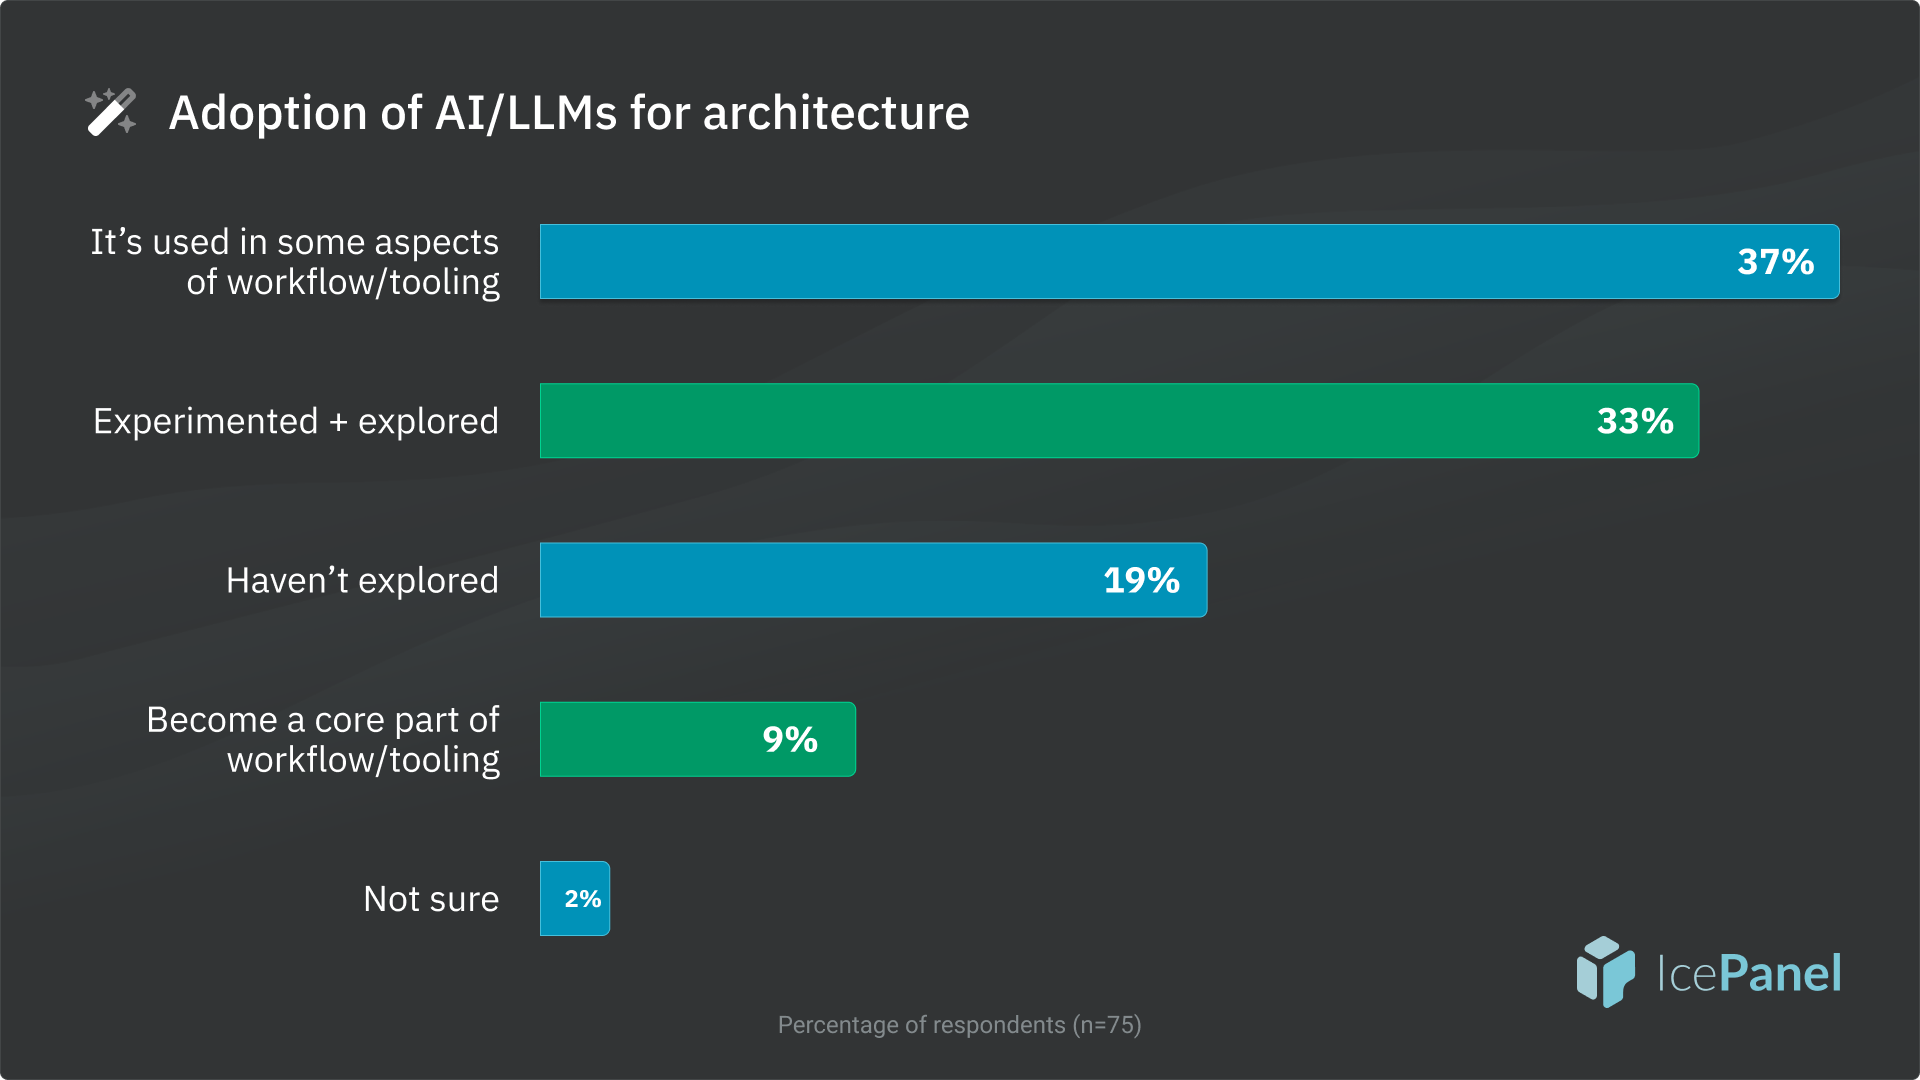
- AI usage is mostly experimental: 37% use it in some workflows, 33% are exploring, 19% haven’t started yet. Main uses include diagram generation, docs creation, and design validation.
- Architects see their role evolving to be more strategic and quality-focused, with AI augmenting rather than replacing their work.
👥 Who answered?
- There were a total of 75 responses.
- More than half (57%) of the respondents were architects, with solution architects being the most common at 29%. Engineers/developers were the second largest group at 29%.
- The majority of respondents were experienced full-time employees (95%), with 6-10 years (29%) and more than 10 years of experience (39%). More tenured respondents responded this year (6+ years of experience).*
- There was a wide range of company sizes, with 100-499 (26%) and 5,000 or more (21%) being the most common.
- Despite the wide range of company sizes, most had a small team of dedicated architects. The most common team size was 1–9 architects, at 51%.
* Difference not statistically significant based on chi-square test.
🤬 Biggest challenge related to architecture
- Keeping documentation up to date: Overwhelmingly, the most common challenge mentioned. People struggle with architectural drift, maintaining the current state in an agile process, and often end up with out of date docs that people lose trust in.
- Lack of standards and consistency: No agreed-upon standard or conventions established. Teams have different interpretations of the C4 model, conflicting views of the system in the org, and scattered tooling with no central source of truth.
- Finding the right level of detail: Dealing with the tension of too much detail and too little. Understanding “how to deep go” when diagramming so it’s valuable, and communicating to different audiences (developers to C-suite).
- Time and resource constraints: Lack of time or the inability to prioritize documentation work. Docs are often seen as a burden rather than a value-add. Justifying the quality of docs vs the speed of delivery.
⚒️ Tooling and practices
This section focuses on specific tooling and practices for creating and maintaining software architecture documentation.
- The majority of respondents used Diagramming tools (87%), followed by collaborative wiki tools (79%), to document software architecture.
- 65% mentioned using a modelling tool , almost identical to 2024 at 64%.
- 44% used AI/LLMs and diagrams-as-code. These were new options this year.
- Physical whiteboarding was still going strong at 40%.
Source of truth of architecture continued to converge in 2 places:
- 42% said it was on a collaborative wiki tool, while 24% said they used a dedicated tool.
- This is a reverse of 2024, where collaborative wiki (29%) was above a dedicated tool (37%).*
- 19% had no single source of truth, and 11% tracked it with code or informally. Both were up from 2024.*
* Both differences were not statistically significant.
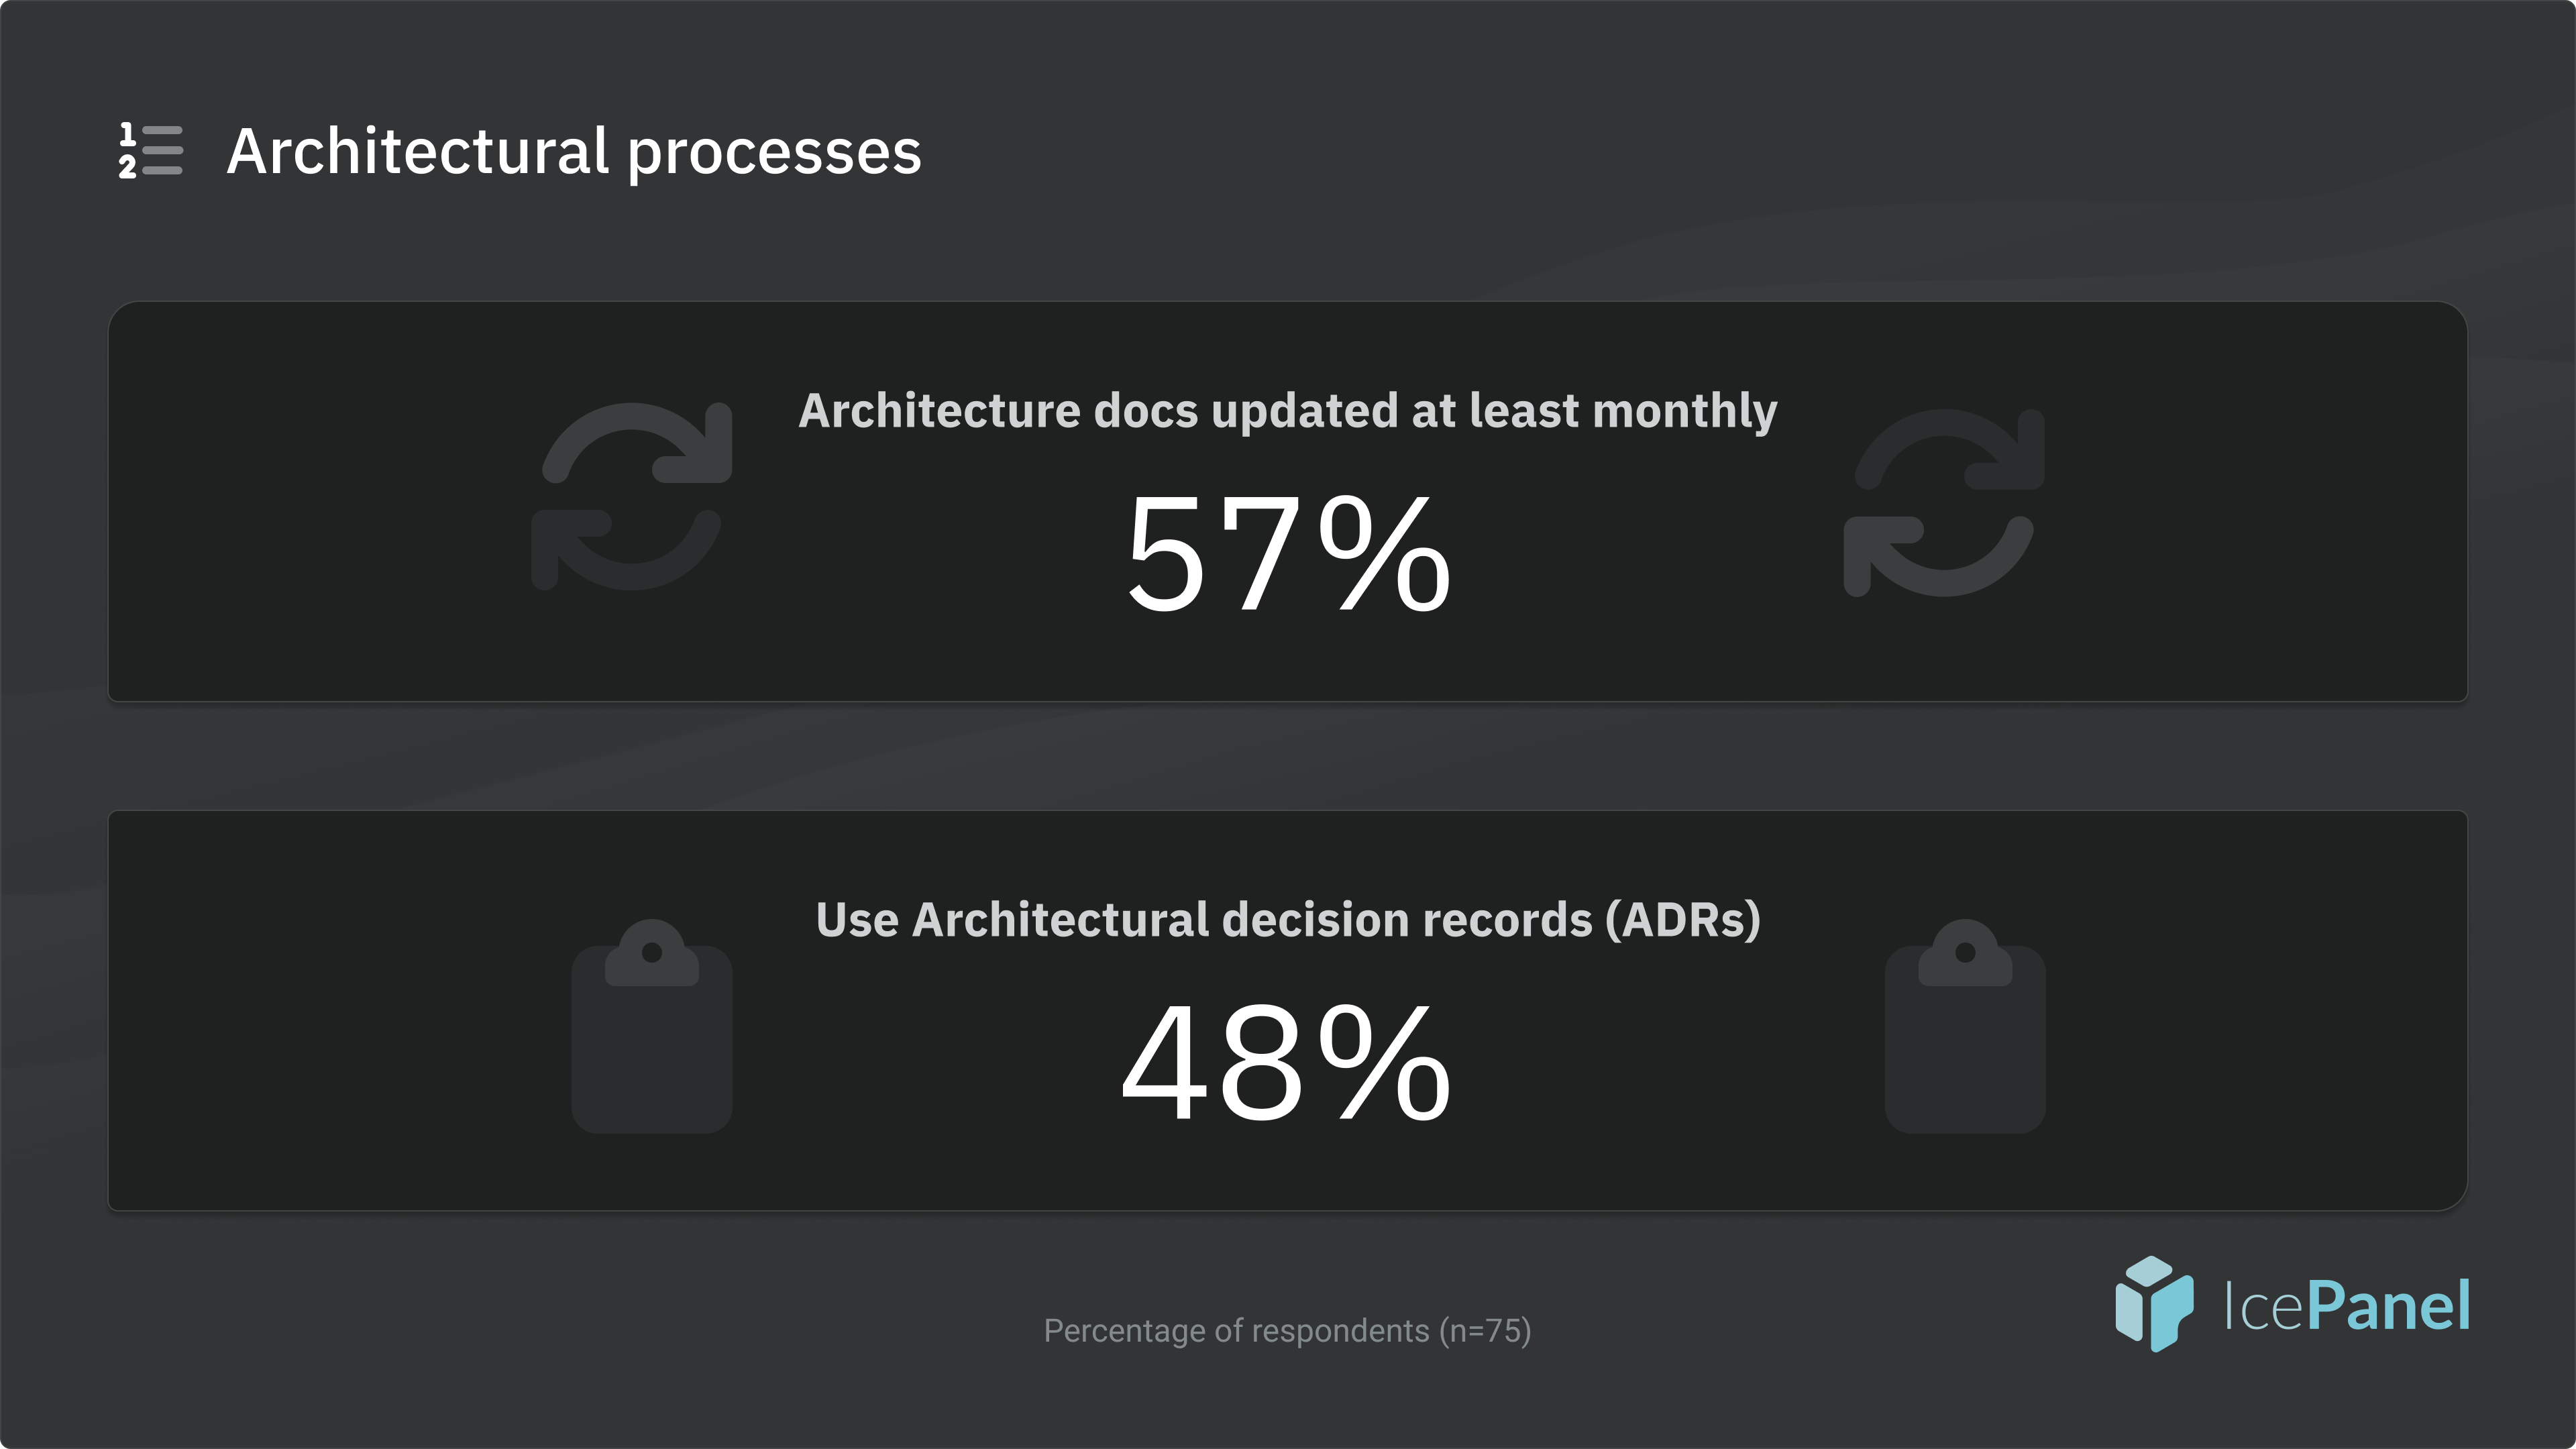
- There was no pattern for how often people updated their architecture documents. It was a close split between monthly (26%), annually (23%), quarterly (23%), and weekly (23%).
- It was a close, even split on using architecture decision records (ADRs). 48% said they use ADRs, and 52% don’t.
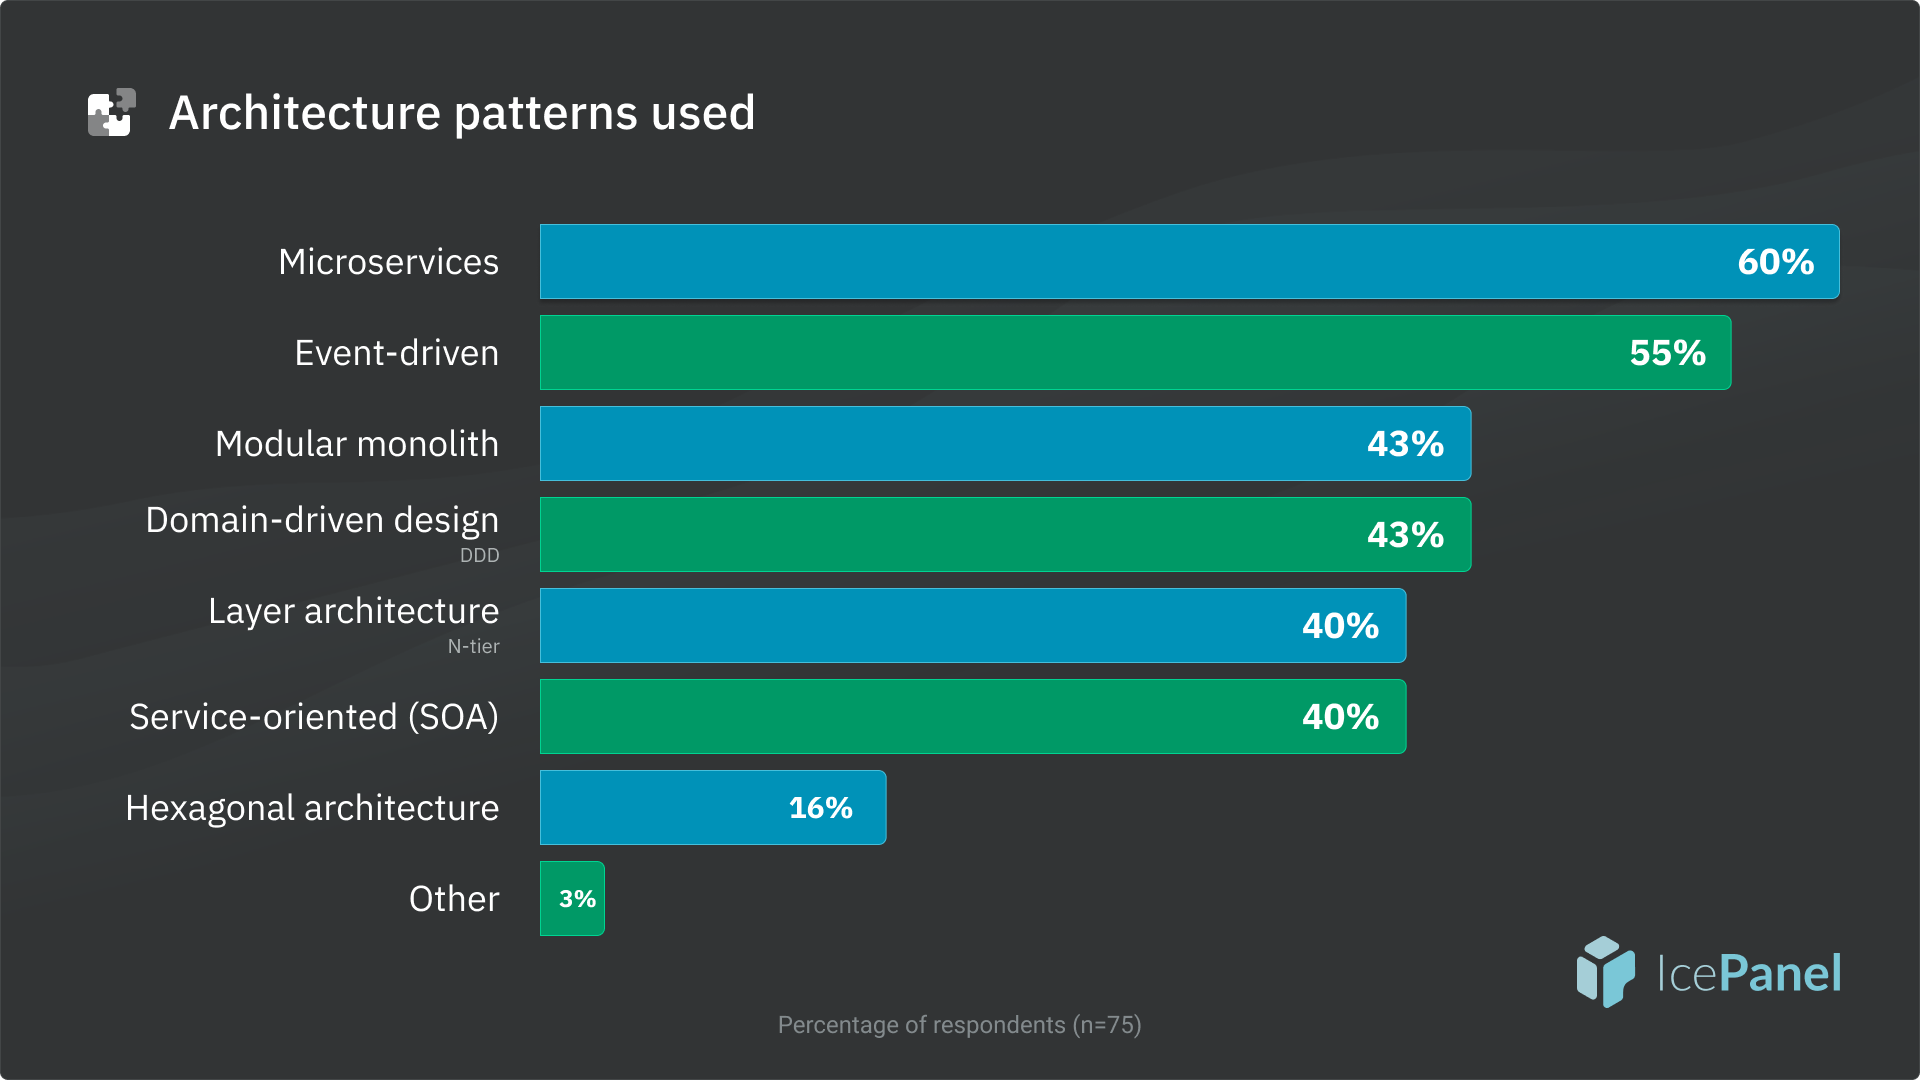
The most common architecture patterns used were microservices (60%) and event-driven (55%). Both of these are down from 2024; however differences were not statistically significant.
4️⃣ C4 model
This section focuses on the adoption of the C4 model and its challenges.
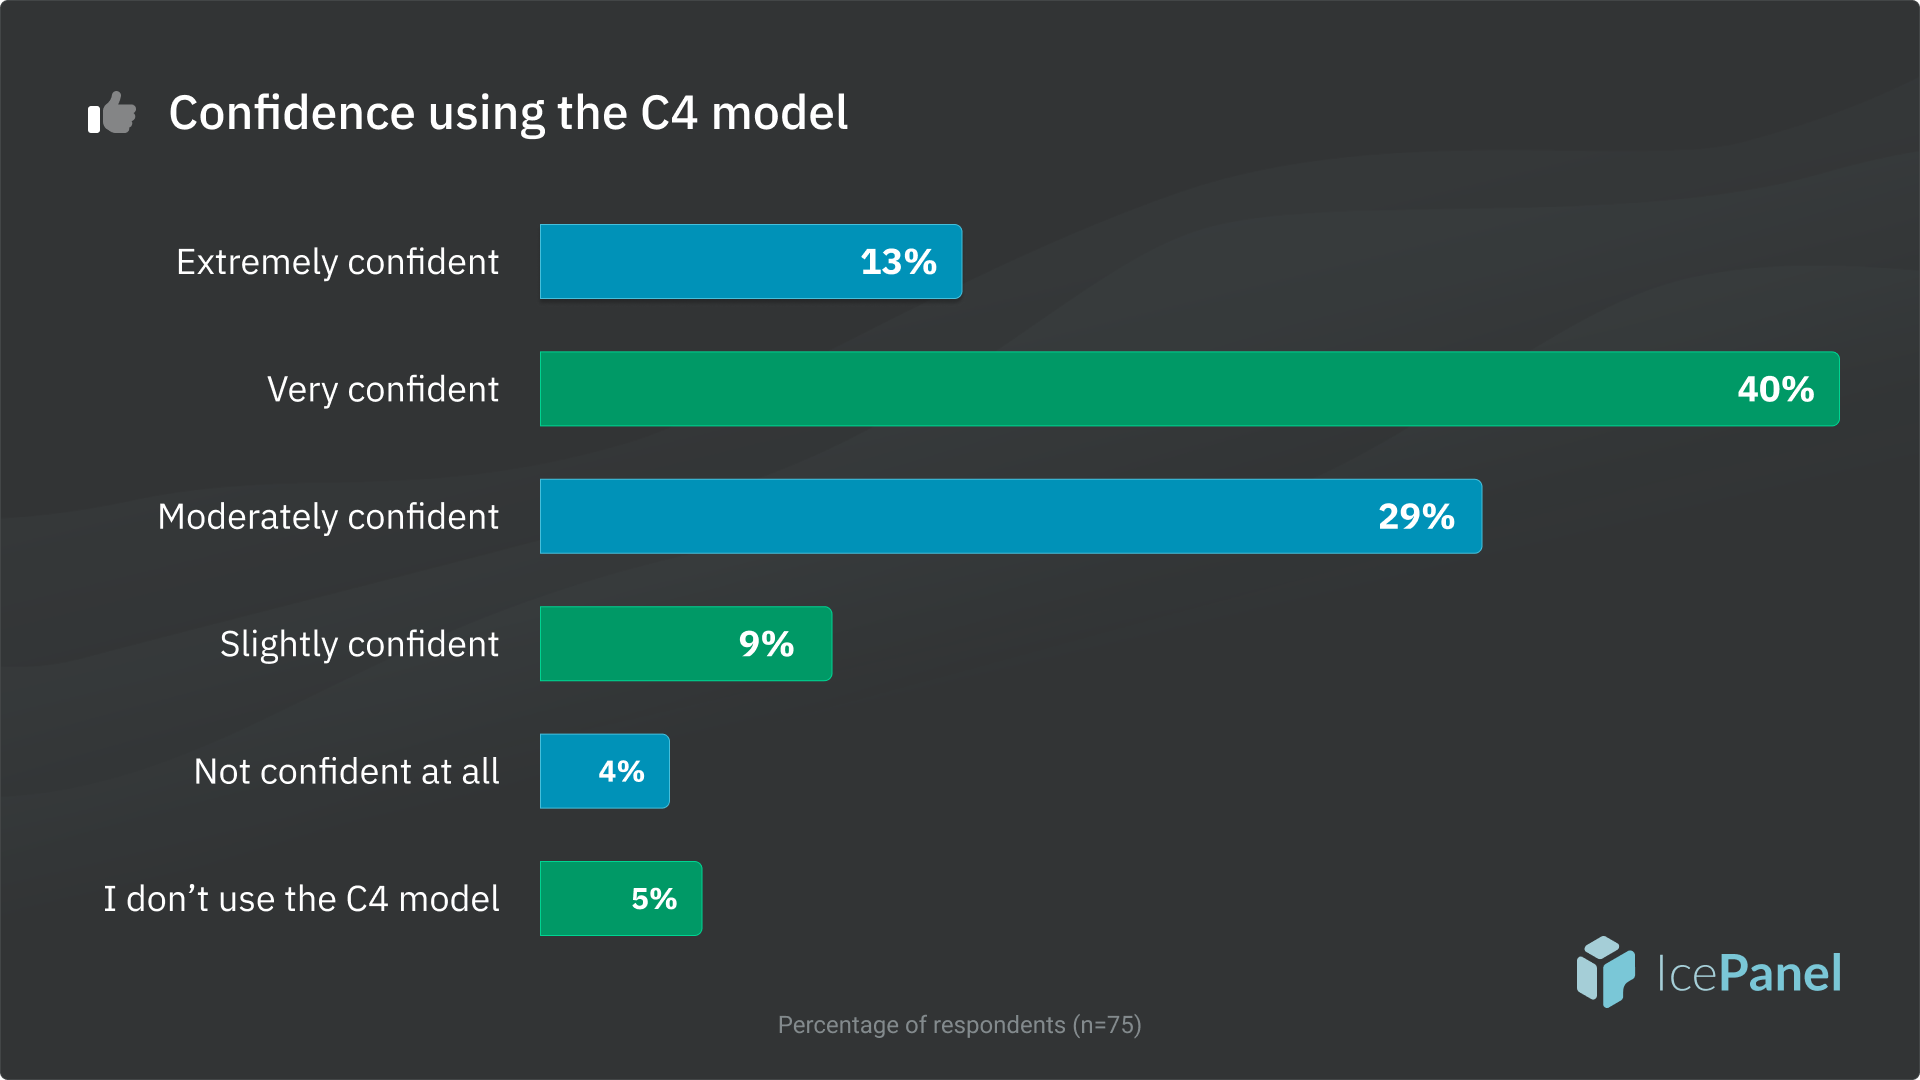
- Most people were moderately (29%) or very confident (41%) in using the C4 model.
- There was a slight increase in overall confidence from 2024, but the difference was not statistically significant.
- We asked respondents who were not confident or only slightly confident to explain in more detail why. Some example responses were: “Lack of interest in adopting it,” or “haven’t spent time learning it yet.”
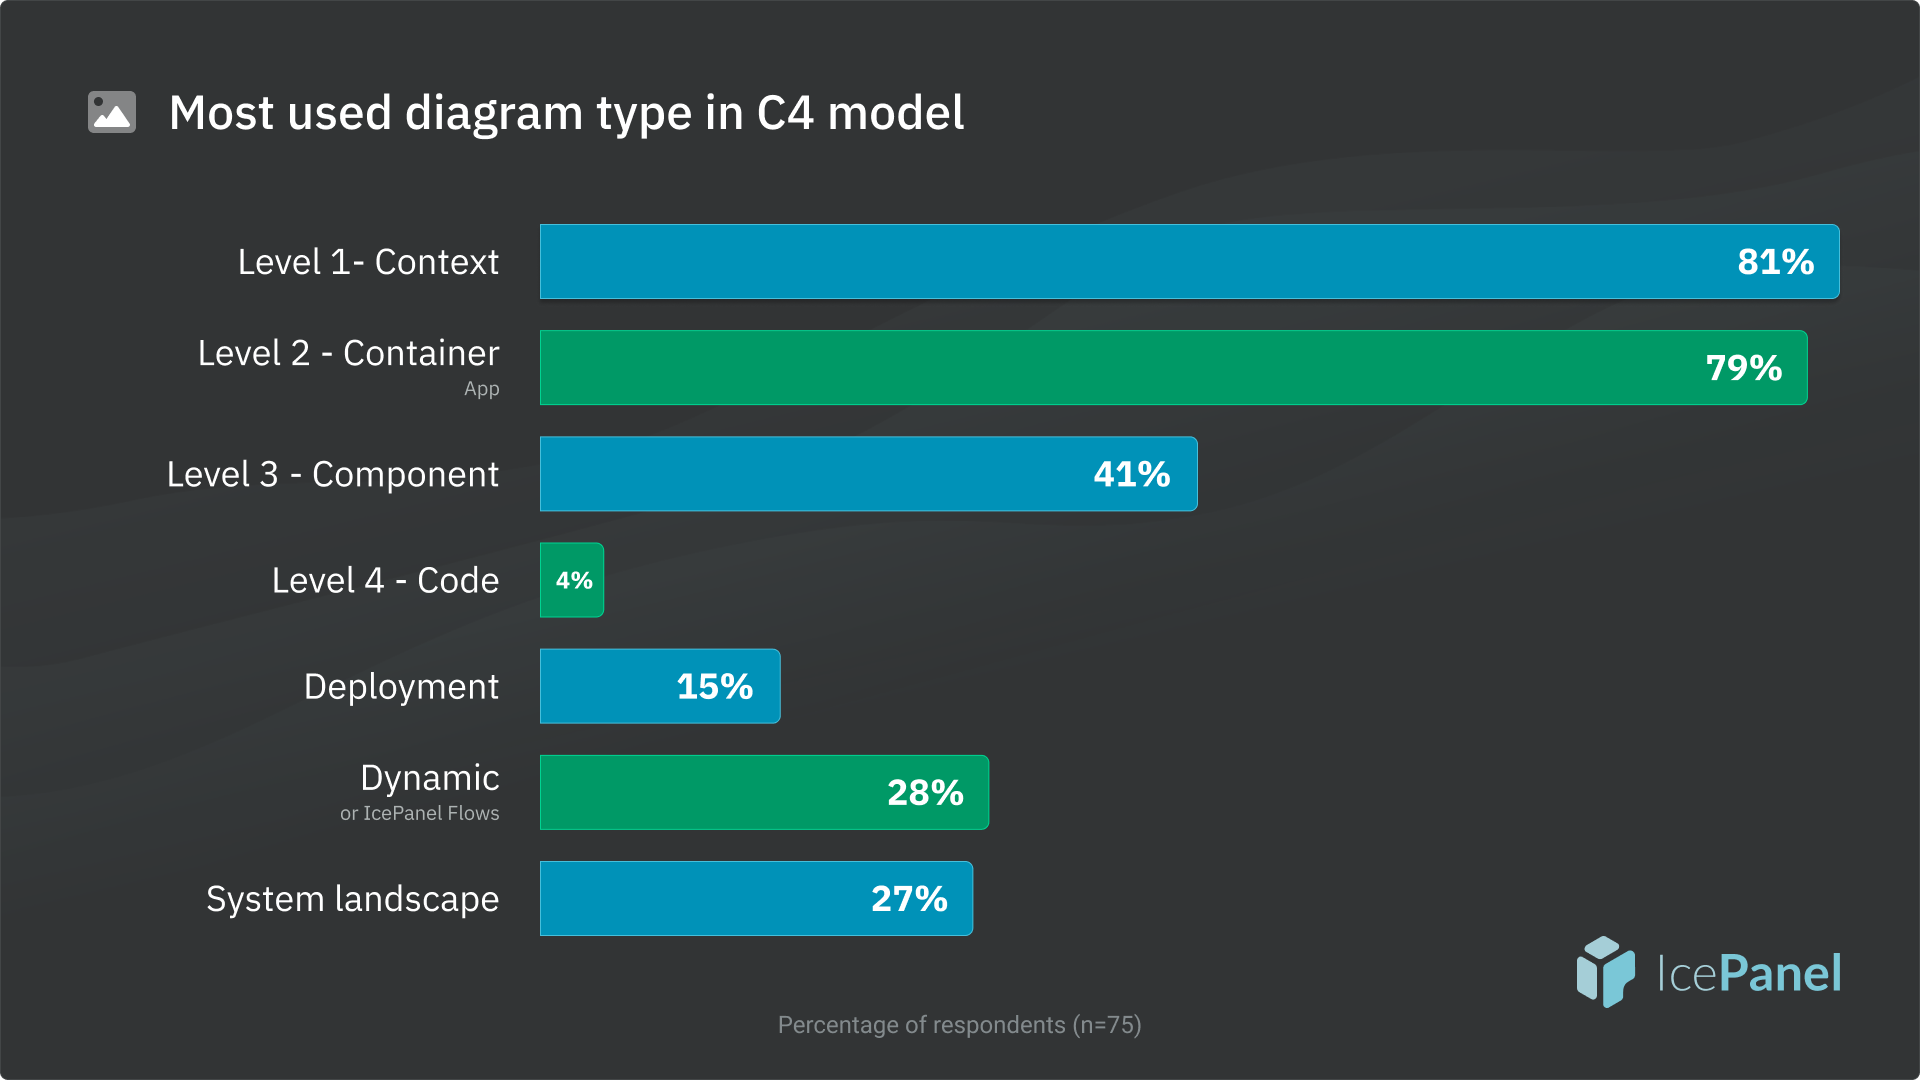
- Context diagrams were the most commonly used diagram type in the C4 model at 81%, followed by Container/app (79%), and Component diagrams (41%).
- Context increased, while container and component decreased from 2024. The increase in context diagram usage was statistically significant (p=0.05/7).
- Among supplementary C4 diagrams, most people used dynamic diagrams/IcePanel Flows (28%) or system landscape diagrams (27%).
🔮 AI/LLMs and the future of software architects
The final section focuses on how AI/LLMs are used and how they impact software architects. These were mostly open-ended questions.
Adoption of AI/LLMs continues to be a work in progress. Most teams are still experimenting:
- 37% said it’s used in some aspects of their workflow/tooling.
- 33% have dabbled in it, but it’s been mostly exploratory.
- 19% have yet to explore it.
In general, people are still in the experimental and early stages of using AI. Many have yet to use it at all and are cautious about fully trusting its output. With that said, a general theme we saw was using AI/LLMs as assistants for brainstorming and gut-checks.
⭐ Top ways people are using AI/LLMs
- Diagram generation: Generating Mermaid diagrams, going from code to diagrams (reverse engineering), automating diagram updates with code changes, and creating a DSL for diagramming tools.
- Creating and summarizing docs: Creating ADRs, translating text for different audiences (technical to business), and summarizing architectures.
- Design validation: Using AI as a thinking partner. “Rubber ducking” designs, sanity checking decisions or asking for a second opinion, exploring potential designs and tradeoffs, evaluating architecture decisions.
- Research and ideation: Brainstorming new ideas and changes, researching different patterns and concepts, asking for suggestions on what could be improved. People using it as a ‘consultancy’.
People see the role of architects evolving into something more strategic and quality-focused, shifting from a creator to a coach/facilitator. In general, people see AI as an augmentation, rather than a replacement, helping them be more efficient by removing a lot of mundane tasks, such as maintaining docs. AI will help architects focus on designing resilient, scalable systems that align with business objectives, rather than lower-level technical decisions.
🧊 That’s a wrap!
Another survey in books. Thanks so much to everyone who participated! If you’ve got any thoughts on the results or ideas for what we should focus on next time, let us know — mail@icepanel.io. We’d love to hear from you!
Stay Chill 🤙
