Introduction
Kubernetes (K8s) is the de-facto standard technology for orchestrating containerised applications at scale. However, visualising it only as a K8s cluster diagram doesn’t express its architecture in a format accessible to all stakeholders. In this post, we’ll talk about K8s, how to visualise it with the C4 model with an example app (ShopFlow), and some tips to get started.
Thinking about architecture with the C4 model works great as a technology-independent abstraction. However, software architectures are often visualised as cloud-specific diagrams like AWS/Azure/GCP diagrams or as Kubernetes cluster views. These diagrams are often static and contain all implementation details at a single view. Details like networking, service meshes, and ingress/egress traffic get in the way when trying to understand the high-level components in the architecture, like core business services or datastores. For organisations running on K8s with little-to-no architectural documentation, there is a modelling problem.
The modelling problem with Kubernetes (K8s)
K8s is the dominant open-source platform for orchestrating containerised applications, maintained by the Cloud Native Computing Foundation (CNCF). It has become the most widely adopted technology for running distributed applications at scale.
K8s comes with its own abstractions and ecosystem, which is great for expressing infrastructure as code (IaC) but not for communicating the architecture as a whole. K8s has declarative resources for networking, scheduling, and service discovery. A Deployment describes how your application runs. A Service gives it a stable network identity. An Ingress handles external routing. A ConfigMap externalises configuration. Other K8s resources can be found in the concepts page.
Inside this ecosystem, deployment and networking details matter to the platform team, but not on an architecture diagram. For example, within an engineering organisation, there are generally three personas that interact with software architecture:
- Platform Owner: Engineers working on the infrastructure layer that supports running services and workloads. These are typically platform engineers, site reliability engineers, and software architects.
- Service Owner: Engineers working on the product itself, owning parts or all of the deployable source code. These are software engineers, machine learning engineers, or product engineers.
- Product Owner: Non-technical stakeholders who own the product roadmap and focus on user-facing interactions and feature delivery. These are product managers or designers.
A K8s cluster diagram works well for Platform Owners because they need to see namespaces, networking, and resource configurations. It’s sometimes useful for Service Owners, who care mainly about their own deployments and how they connect to other services. But it’s rarely useful for Product Owners, who need to understand what the system does without going through infrastructure detail.
The C4 model supports all three personas by offering different levels of detail. Level 1 (Context) gives Product Owners the big picture. Level 2 (Container) gives Platform and Service Owners a clear view of deployable units and their relationships. Level 3 (Component) lets Service Owners zoom into the internals of a specific service. Platform Owners can refer to K8s clusters for more networking details.
In general, K8s describes how architecture is deployed and operated while C4 models the logical architecture. They’re complementary views, not competing ones.
Mapping Kubernetes to the C4 model
So how does translating a Kubernetes cluster into the C4 model work?
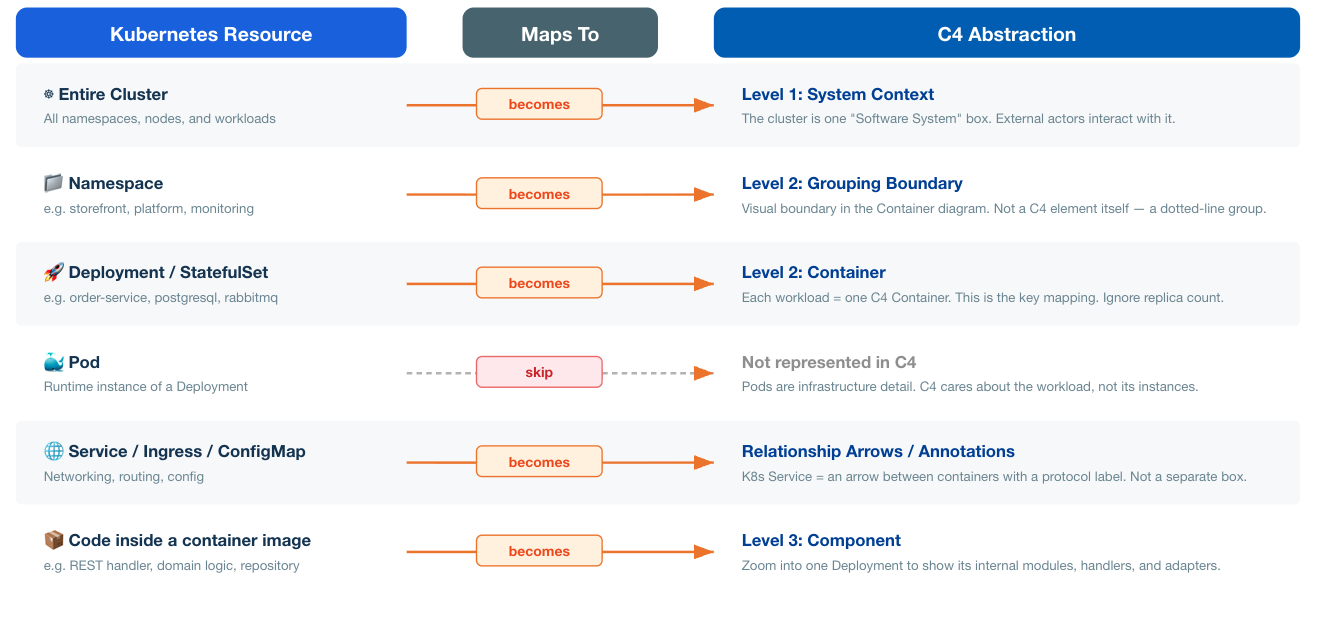
1. Cluster = Context diagram
For starters, the cluster becomes a single Context layer. In this view, the emphasis is on what the system does and who interacts with it (actors and external systems). At a high level, we draw the third-party APIs the cluster depends on and the users who interact with the system (e.g., admins and customers).
2. K8s namespace is a dotted boundary, not a C4 diagram
A K8s namespace is a logical grouping of resources within a cluster. It is a useful mechanism for isolating groups of resources together, but not modelled as a first-class element in the C4 model. For C4, it is a visual dotted-line boundary on the Container diagram. It could also be represented as a Group.
3. Deployments = Container diagrams
A K8s deployment defines how an application runs and scales. It specifies the number of instances to run, resource limits, and other metadata. In the C4 model, the Container diagram highlights a set of deployable/runnable units that power the system. Each unit is a K8s deployment. Pods are runtime instances that wrap one or more running containers (not to be confused with Container diagrams!). They do not belong to the C4 model since this is already abstracted by the deployment resource. Code inside the pod belongs to the Component diagram, where you show internal structure like REST handlers, API clients, and domain logic.
4. Services, Ingresses, and ConfigMaps become annotations or arrows.
A K8s service is a networking mechanism that lets one workload talk to another. In C4, that’s just an arrow between two Containers with a protocol label. Other resources like Ingress rules, ConfigMaps, or Secrets are operational details that don’t need their own boxes on a Container diagram.
ShopFlow: Kubernetes Cluster
To see this mapping in practice, let’s take an e-commerce app called ShopFlow. It is a simplified version of Amazon.com where customers browse products, place orders, and pay online. The system runs on a single K8s cluster.
The cluster is organised into three namespaces:
- main — the core business services. This is where the actual e-commerce logic lives: a Web App serving the customer-facing storefront, an API Gateway routing requests to backend services, a Product Catalog Service, an Order Service handling checkout flows, a Payment Service integrating with Stripe, and a Notification Service that sends order confirmations via email and SMS. Data is stored in PostgreSQL, and services communicate asynchronously through RabbitMQ.
- platform — the core infrastructure. For example, NGINX for traffic routing and Istio for managing the service mesh. These are workloads that the platform team owns, not the software teams.
- monitoring — the observability stack. Prometheus and Grafana for metrics and dashboards, Fluentd shipping logs to Loki.
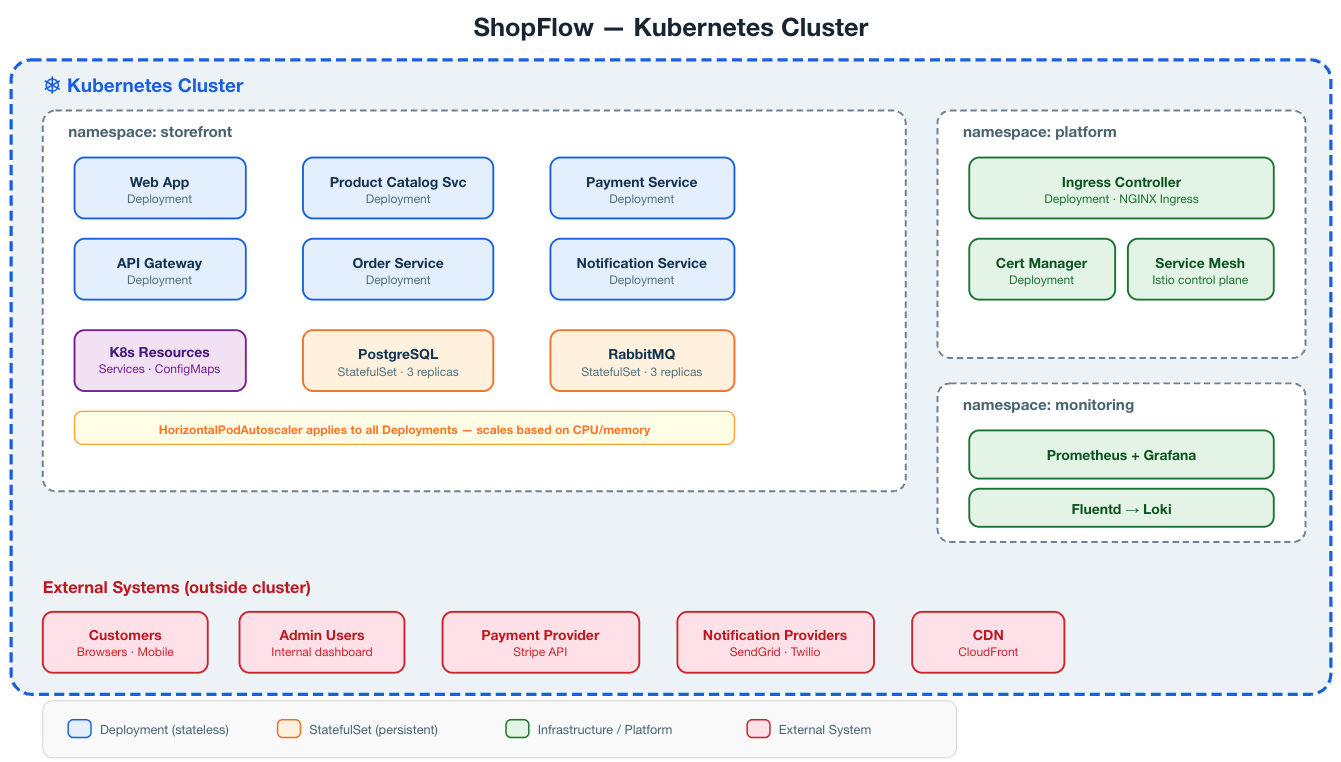
Given this K8s cluster, how should this be modelled using C4 diagrams? For this scope, we’ll only focus on the main namespace.
ShopFlow: C4 Model
See complete design on IcePanel: https://s.icepanel.io/DWnaysJ3cbCQqg/QXrC
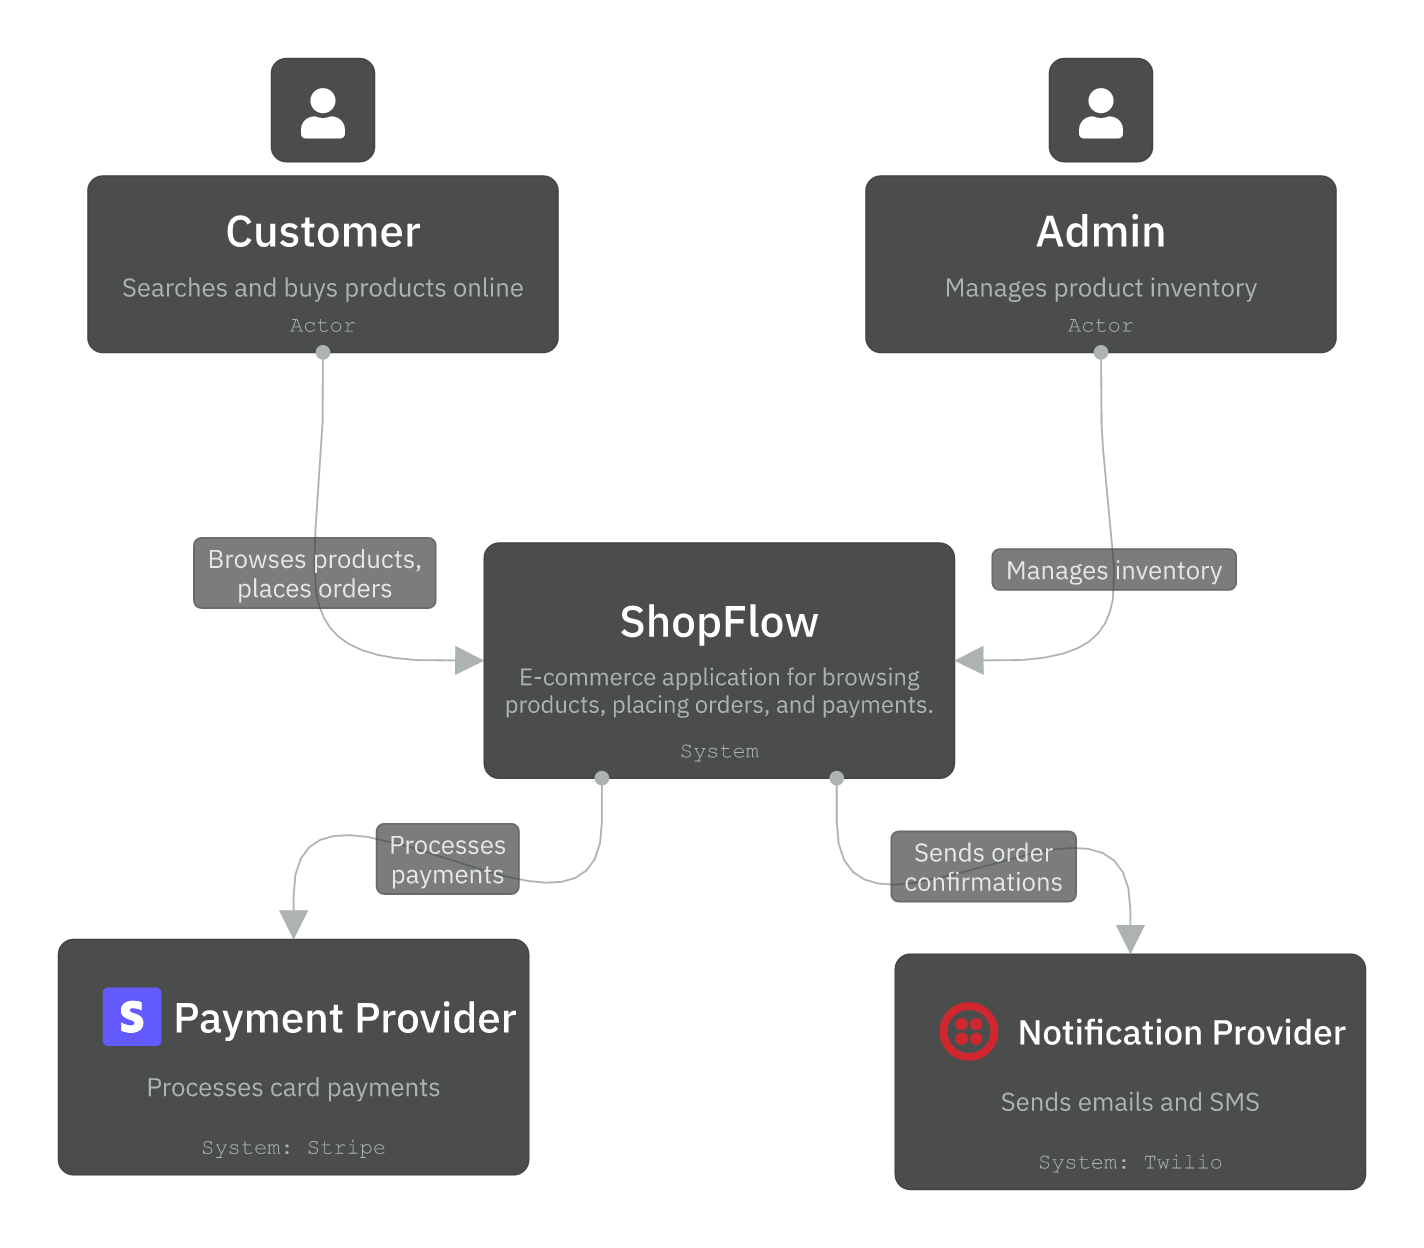
Level 1: Context diagram
The Context (system) diagram is for stakeholders who need to understand what the system does and what it depends on. Think product managers, business stakeholders, and new engineers getting onboarded. In this example, we have two external systems that ShopFlow depends on: a payment provider and a notifications provider. There are two main actors: customers and admins.
Level 2: Container diagram
We zoom inside ShopFlow to show its separately deployable units, Containers.
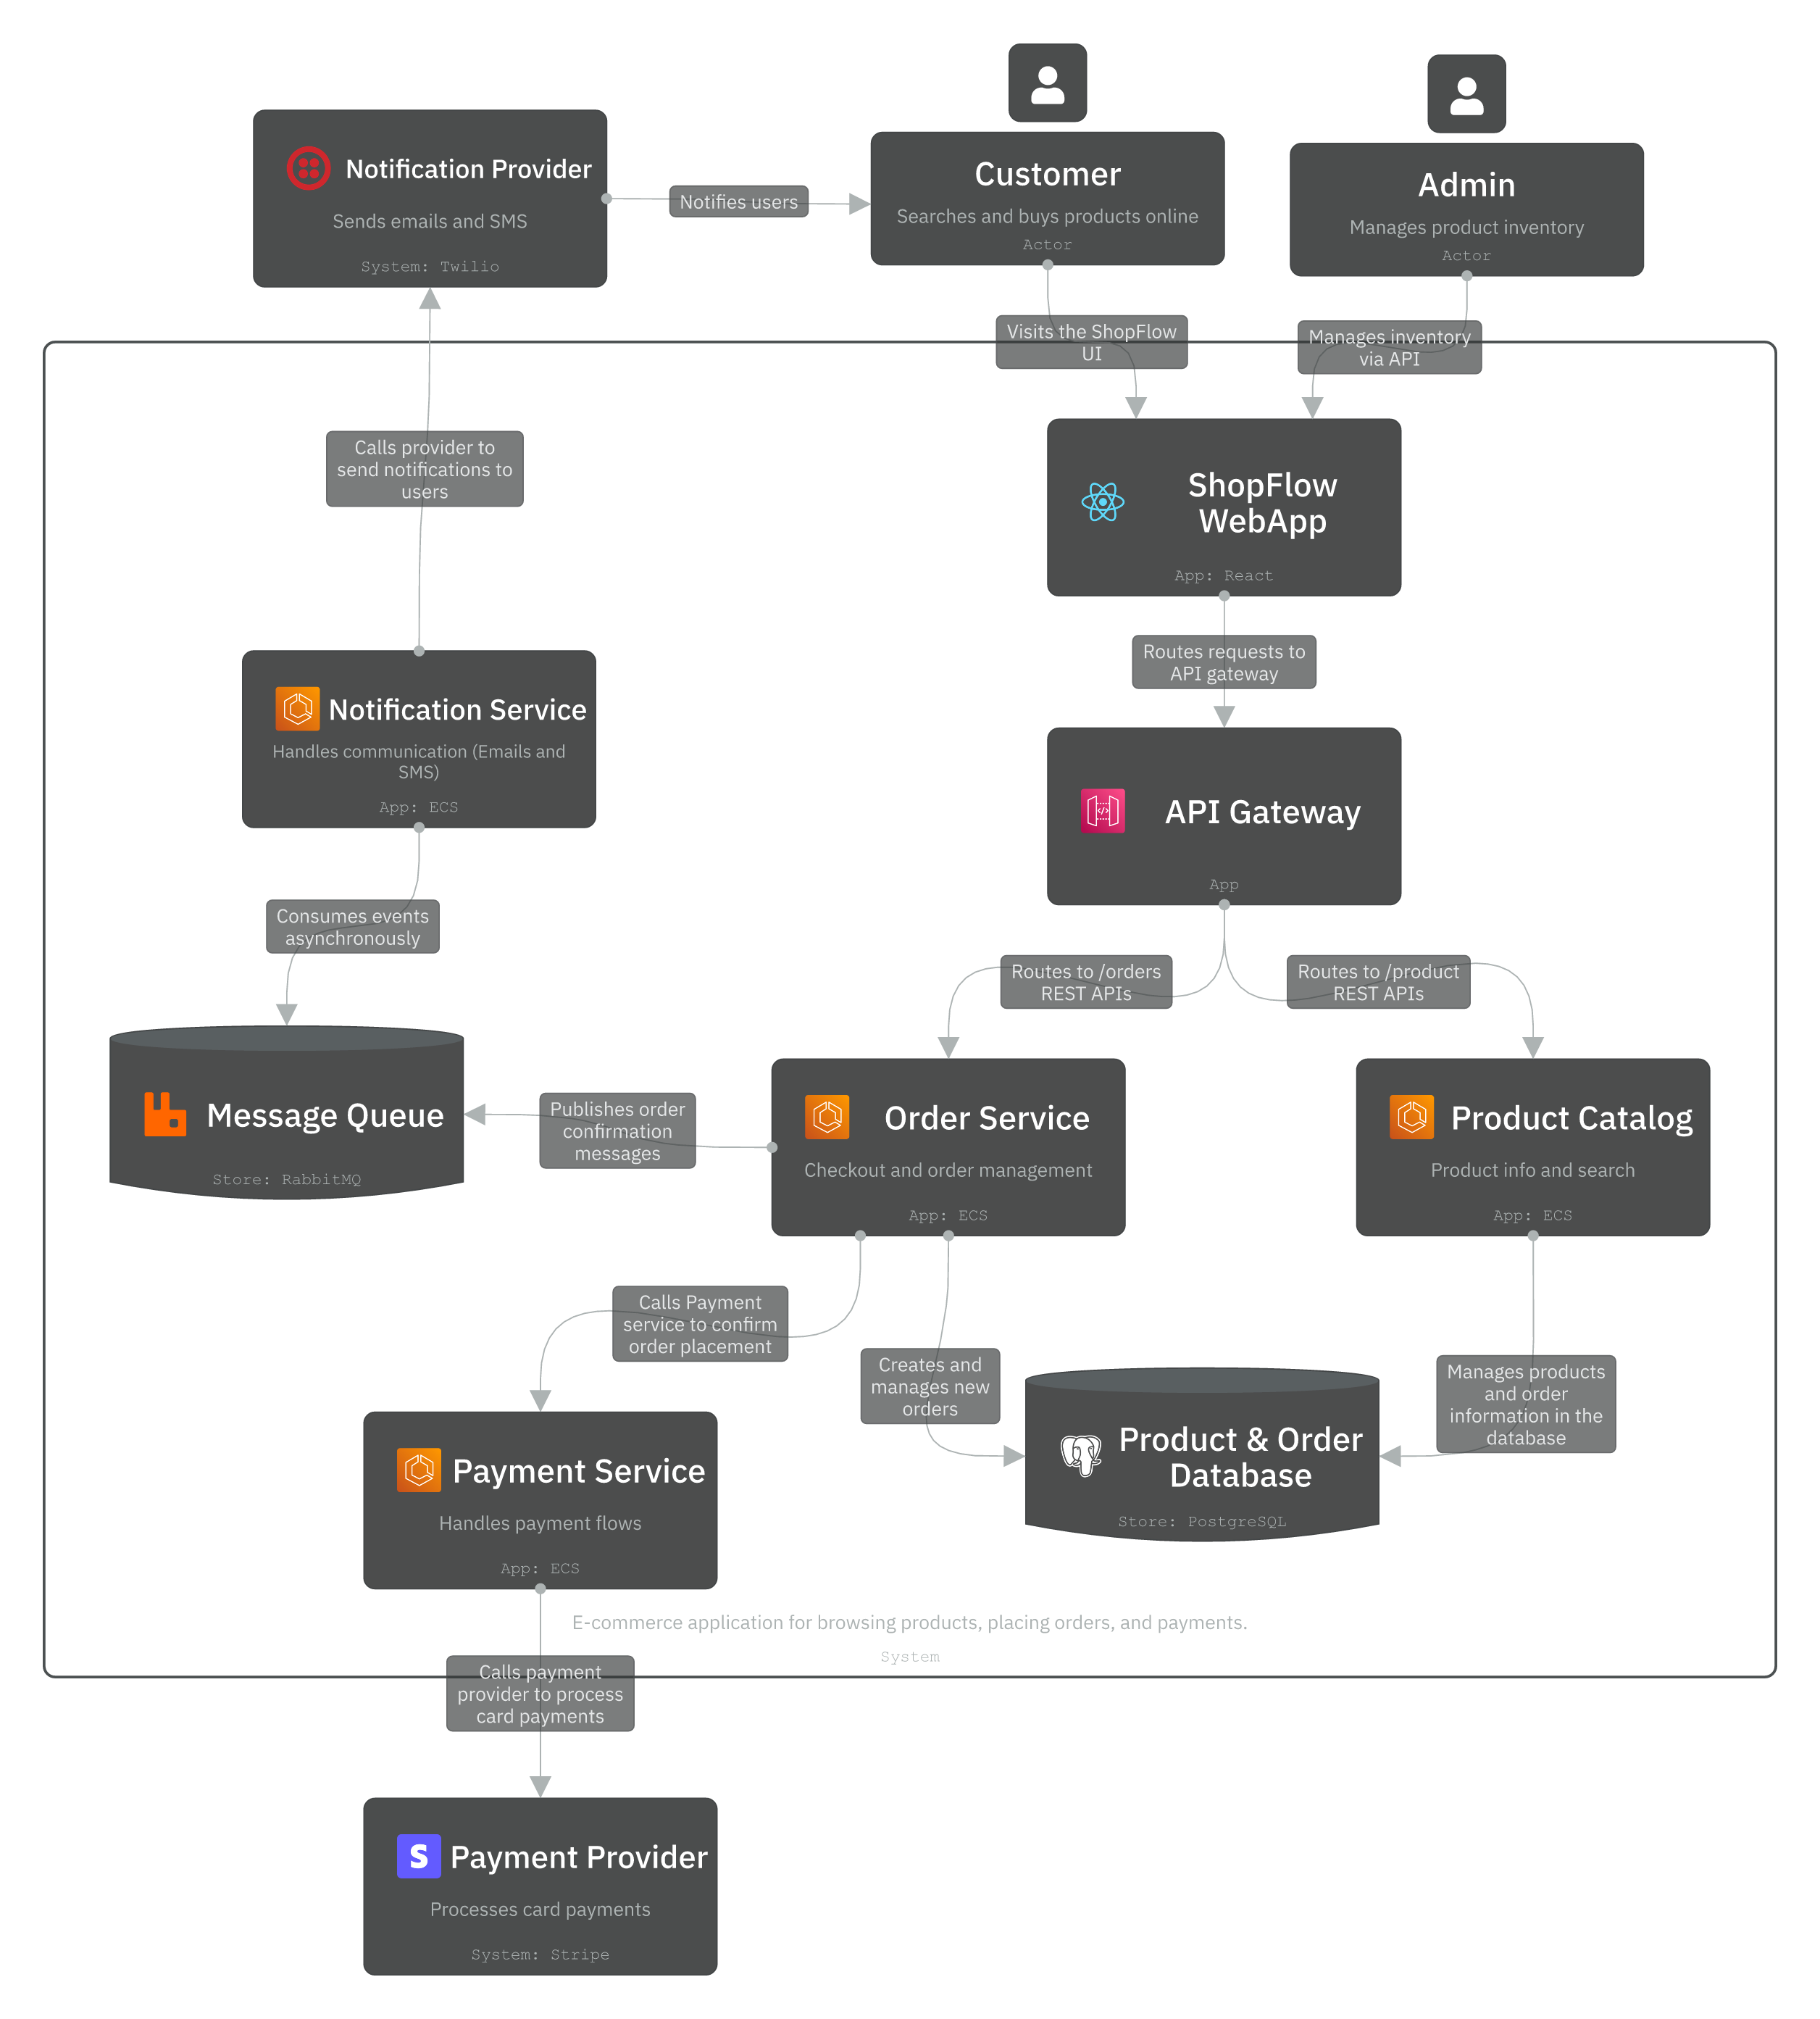
In this Container view, every service is deployed as a K8s Deployment (except datastores and gateways, which can be deployed as managed cloud services like AWS). We have:
- ShopFlow WebApp: for showing product information and order history in the UI.
- API Gateway: for routing requests to backend.
- Product Catalog: for viewing available products and details.
- Order Service: for managing incoming orders.
- Payment Service: for managing payment flows.
- Notification Service: for sending events to customers.
- Message Queue: for inter-service communication.
- PostgreSQL: for persisting product data and order history.
These deployable units are abstracted within the Container diagram without additional details specific to K8s. Networking details are kept minimal here to reduce cognitive load on viewing these diagrams. In general, every K8s deployment should be represented as a Component inside the Container view.
Level 3: Component diagram
Below is the Component diagram of the “Order Service”. It contains the following modules:
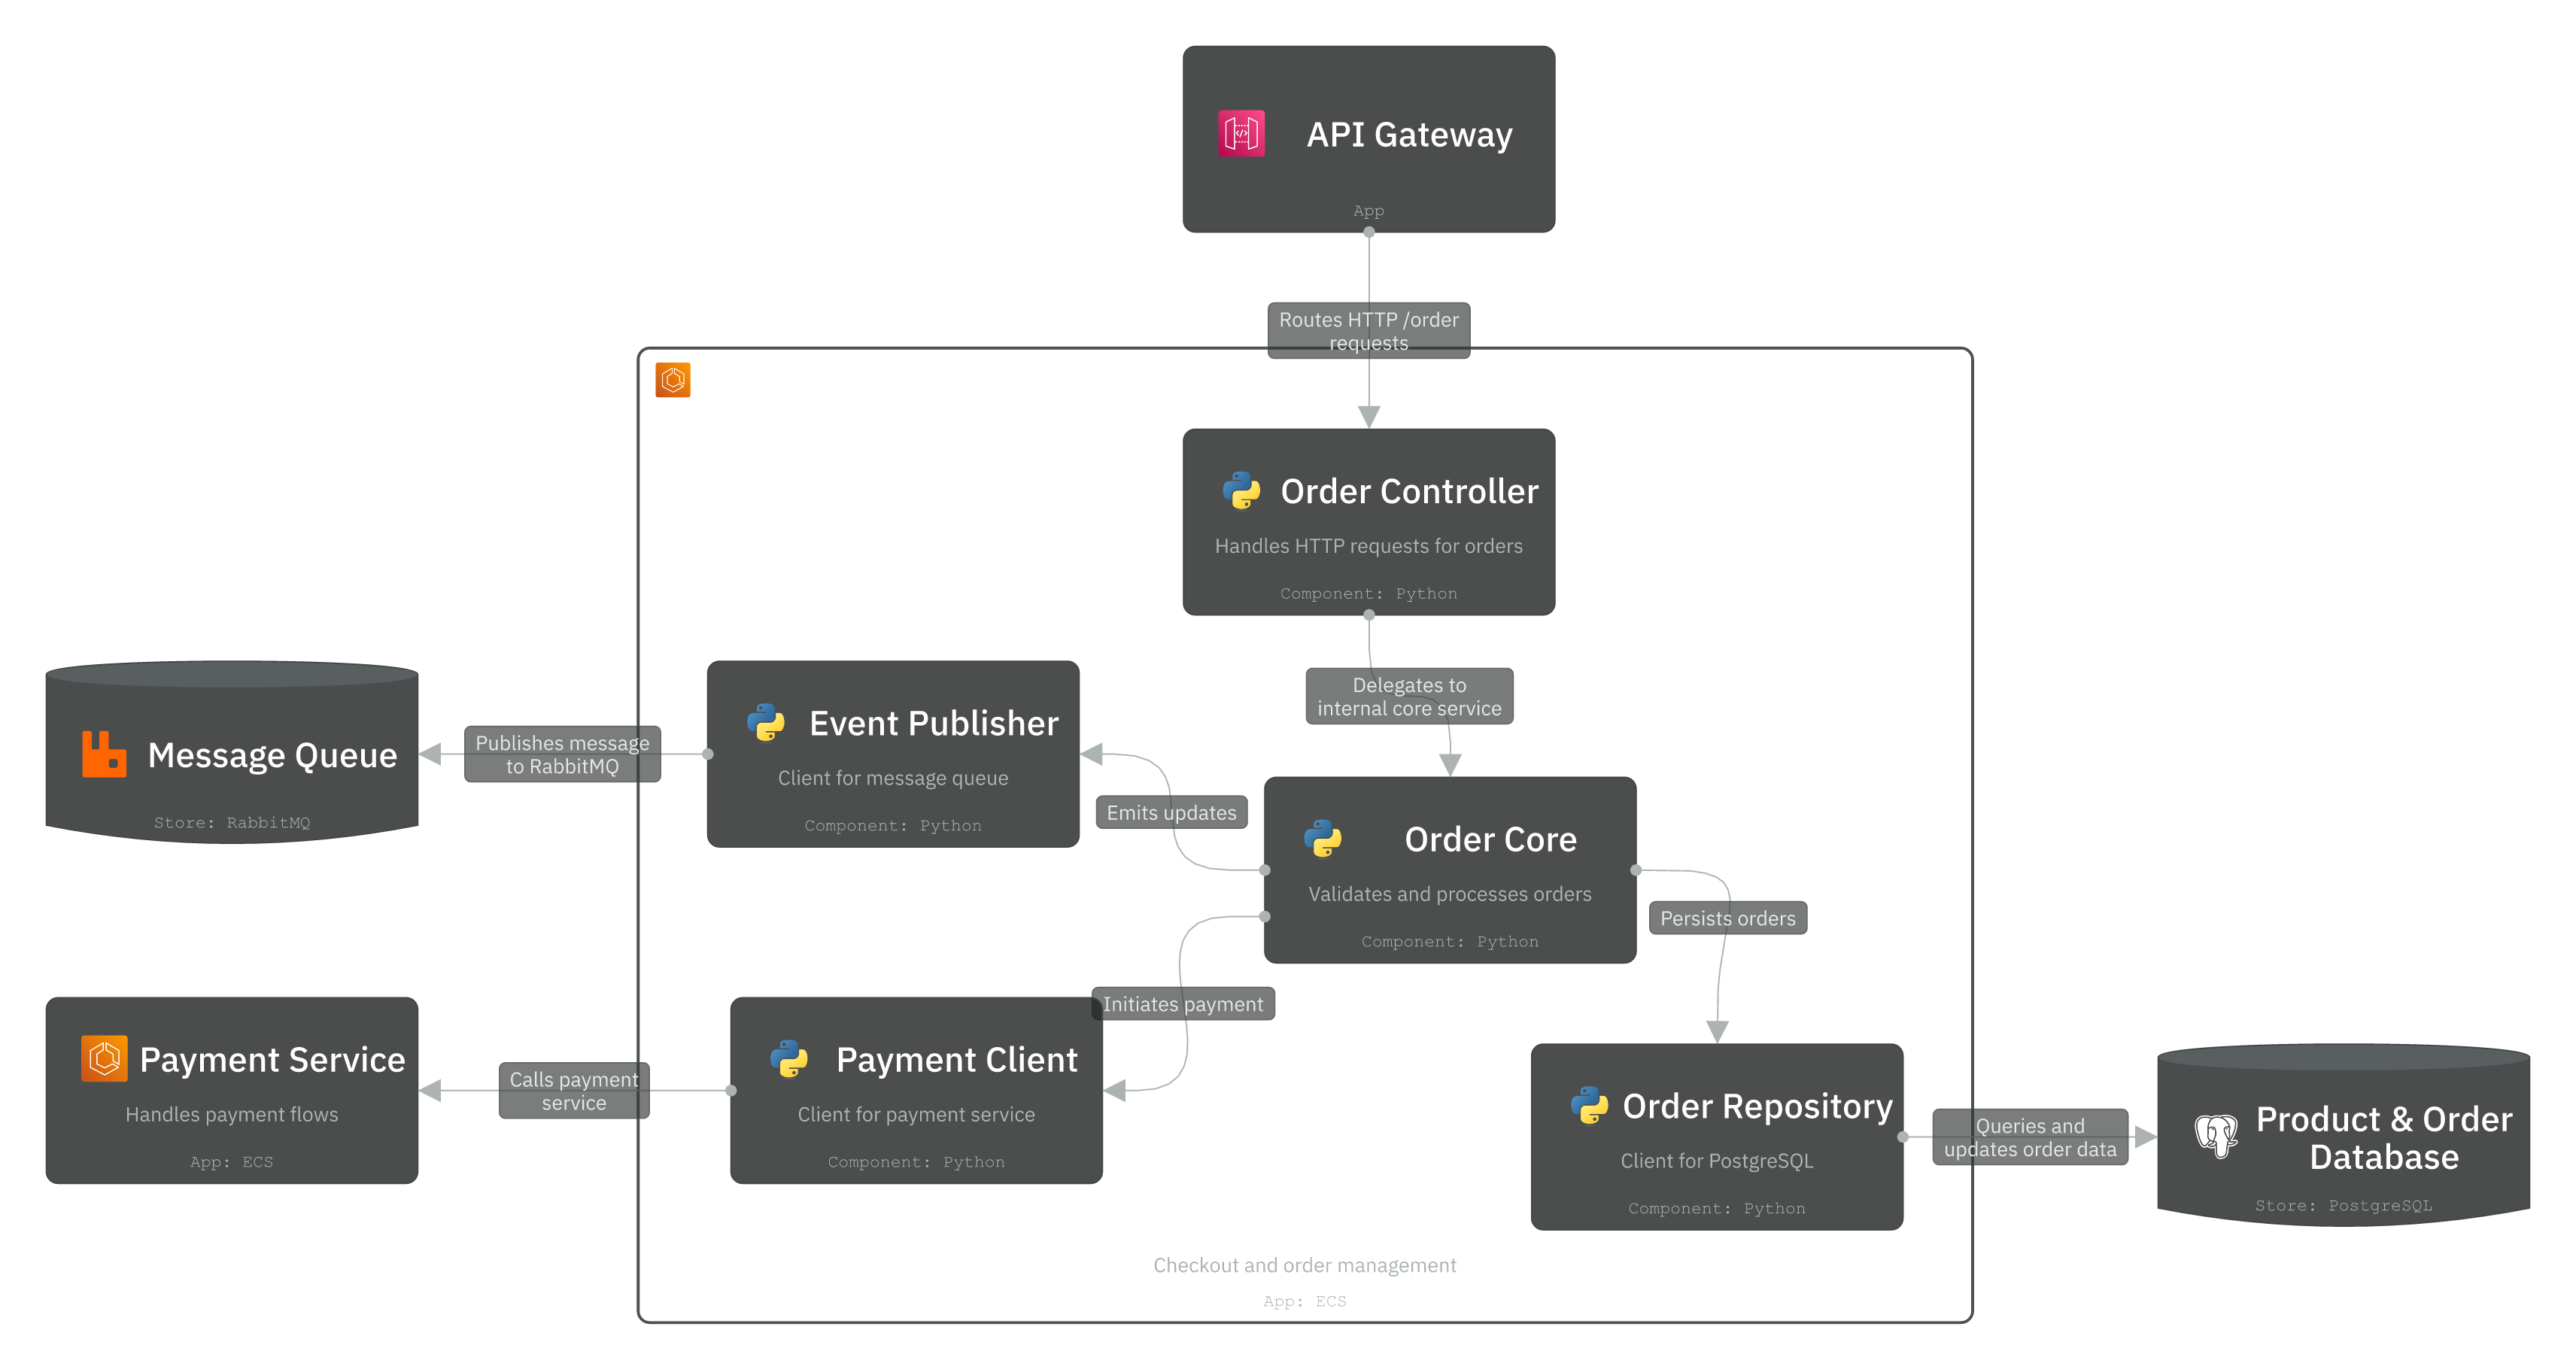
- The Order Controller handles incoming HTTP requests. It receives requests from the API Gateway and delegates to the appropriate internal component.
- The Order Core validates orders, applies business rules, and coordinates the checkout flow.
- The Order Repository handles data persistence to PostgreSQL. It encapsulates data access patterns so the domain logic doesn’t know or care about SQL.
- The Event Publisher publishes domain events (e.g., OrderPlaced, OrderCancelled) to RabbitMQ. The Notification Service consumes these events downstream.
- The Payment Client calls the Payment Service to charge the customer.
Notice that at Level 3, we’re no longer thinking about K8s. This diagram describes the internal structure of a single deployable unit. You’d draw the same Component diagram whether the Order Service runs on Kubernetes, AWS ECS, or your laptop. That’s what makes C4’s abstraction consistent.
We won’t cover the fourth diagram (Code) in this example, but you get the idea.
Tips for modelling K8s clusters
To get started, here are three tips for modelling K8s clusters with C4.
1. Focus on the high-level design
Avoid going into the networking details in the K8s world. For example, don’t describe which resources can talk to each other with network policies (similar to AWS’ security groups) or how Istio proxies work. Instead, focus on the Deployments and Services in K8s to map out the user flow.
2. Focus on the resources that enable user flow
If you trace a user flow from start to finish, which workloads does it touch? This is the Container view. Everything else is supporting infrastructure that can be mentioned in annotations or separate documentation, not in the C4 model.
3. Use namespaces as visual groups, not architectural boundaries.
Namespace is a K8s organisational tool. Some teams use namespaces per-team, others per-environment, others per-domain. Use the namespace structure on your C4 diagrams if it helps readers, but don’t let it dictate your architecture.
Here’s also a quick guide for mapping K8s to C4:
Conclusion
Working with the C4 model should not reduce the value of K8s diagrams. One communicates the architecture at different layers, the other describes how the architecture is deployed.
C4 works great for team collaboration as a technology-agnostic framework for visualising systems. K8s is great for showing implementation details, not a high-level overview.
