Introduction
One of our core principles at IcePanel is audience first. Architecture is designed for different audiences, not just for engineers. For example, teams like financial planning & analysis (FP&A) need visibility into the systems they’re budgeting for. How much does this service cost to run? What infrastructure supports this product line? Where are we over-provisioned?
These are questions FP&A teams ask regularly, and they usually rely on engineers to answer them manually. Plus, we don’t believe in knowledge gatekeeping.
In this post, we’ll walk through how FP&A teams can use IcePanel to view software architectures and support budgeting, forecasting, and cost analysis without being blocked by engineering.
What is FP&A?
Financial planning & analysis (FP&A) is the function responsible for budgeting, forecasting, and analysing a company’s spending. In tech companies, FP&A teams work closely with engineering leadership to understand infrastructure costs, allocate budgets across teams or product lines, and forecast future spending. They’re the people asking “how much does it cost to run this product?” and “which product line should we invest in next quarter?”.
TL;DR - If you’ve ever been asked by finance to justify your cloud bill, that’s FP&A.
The problem: FP&A teams operate in the dark 🌚
FP&A teams are responsible for analysing the cost of running software systems. But they rarely have direct access to the architecture behind those systems. Instead, they depend on secondhand information from the architects. Information is inevitably scattered across spreadsheets, Slack threads, and documentation with probably a stale diagram from six months ago.
This creates a few problems. First, the information is often outdated by the time it reaches finance. Systems evolve, new services get spun up, old ones get decommissioned. Second, when diagrams do exist, they’re built for engineers. They’re too technical, too detailed, and don’t map to the cost structures FP&A cares about. Third, questions are naturally repetitive due to a lack of shared documentation. Questions like “What does this service do?”, “How many environments do we run?”, or “Is this still active?”. These are reasonable questions that shouldn’t require an engineer to answer every time.
The problem is that FP&A teams make budgeting and forecasting decisions without a clear picture of the systems they’re funding. They are a different type of audience operating in the dark.
What FP&A actually needs from architecture
FP&A doesn’t need to understand internal details like data models or API endpoints. They need to understand the utilisation and spending of resources (like CPU/RAM/Disk) we need to run the business.
So their questions look more like: What infrastructure do they run on? How do services map to product lines or cost centres? Where is spending concentrated?
This is a different layer of the architecture. In a C4 world, this is focused on Context and Containers through a financial lens. Not Components or Code. The information exists inside the model but hasn’t been made accessible to the people who need it for budgeting.
What FP&A actually needs is a set of views (or diagrams) that are high enough to map business units and cost centres and detailed enough to understand what’s driving infrastructure spend. To them, that is just enough context to make financial decisions.
How IcePanel supports this workflow
IcePanel’s model viewer lets all stakeholders (including non-technical) explore the architecture without needing to understand how to read engineering diagrams. The C4 model provides layered views, from high-level system context down to components. FP&A teams can stay at the top layers where systems and services are visible and map to things they recognise: product lines, cloud providers (AWS, GCP, Azure), infrastructure costs (servers, databases, etc.).
IcePanel maintains a single model as the source of truth, which means FP&A is always looking at the current state of the architecture. There is no split-brain situation where diagrams are inconsistent, or one diagram is more accurate than the other.
Picture this: FP&A needs to forecast infrastructure costs for the next quarter. They open IcePanel, explore the system landscape, identify which cloud services support which products, and use that context to inform their budget. If a new service was added last sprint, it’s already in the model. If an old one was decommissioned, it’s gone. Architects can modify objects through APIs/SDK, or engineers can update the model in the UI.
The architecture stays current, and FP&A can still self-serve, sweet!
Case study: E-commerce software
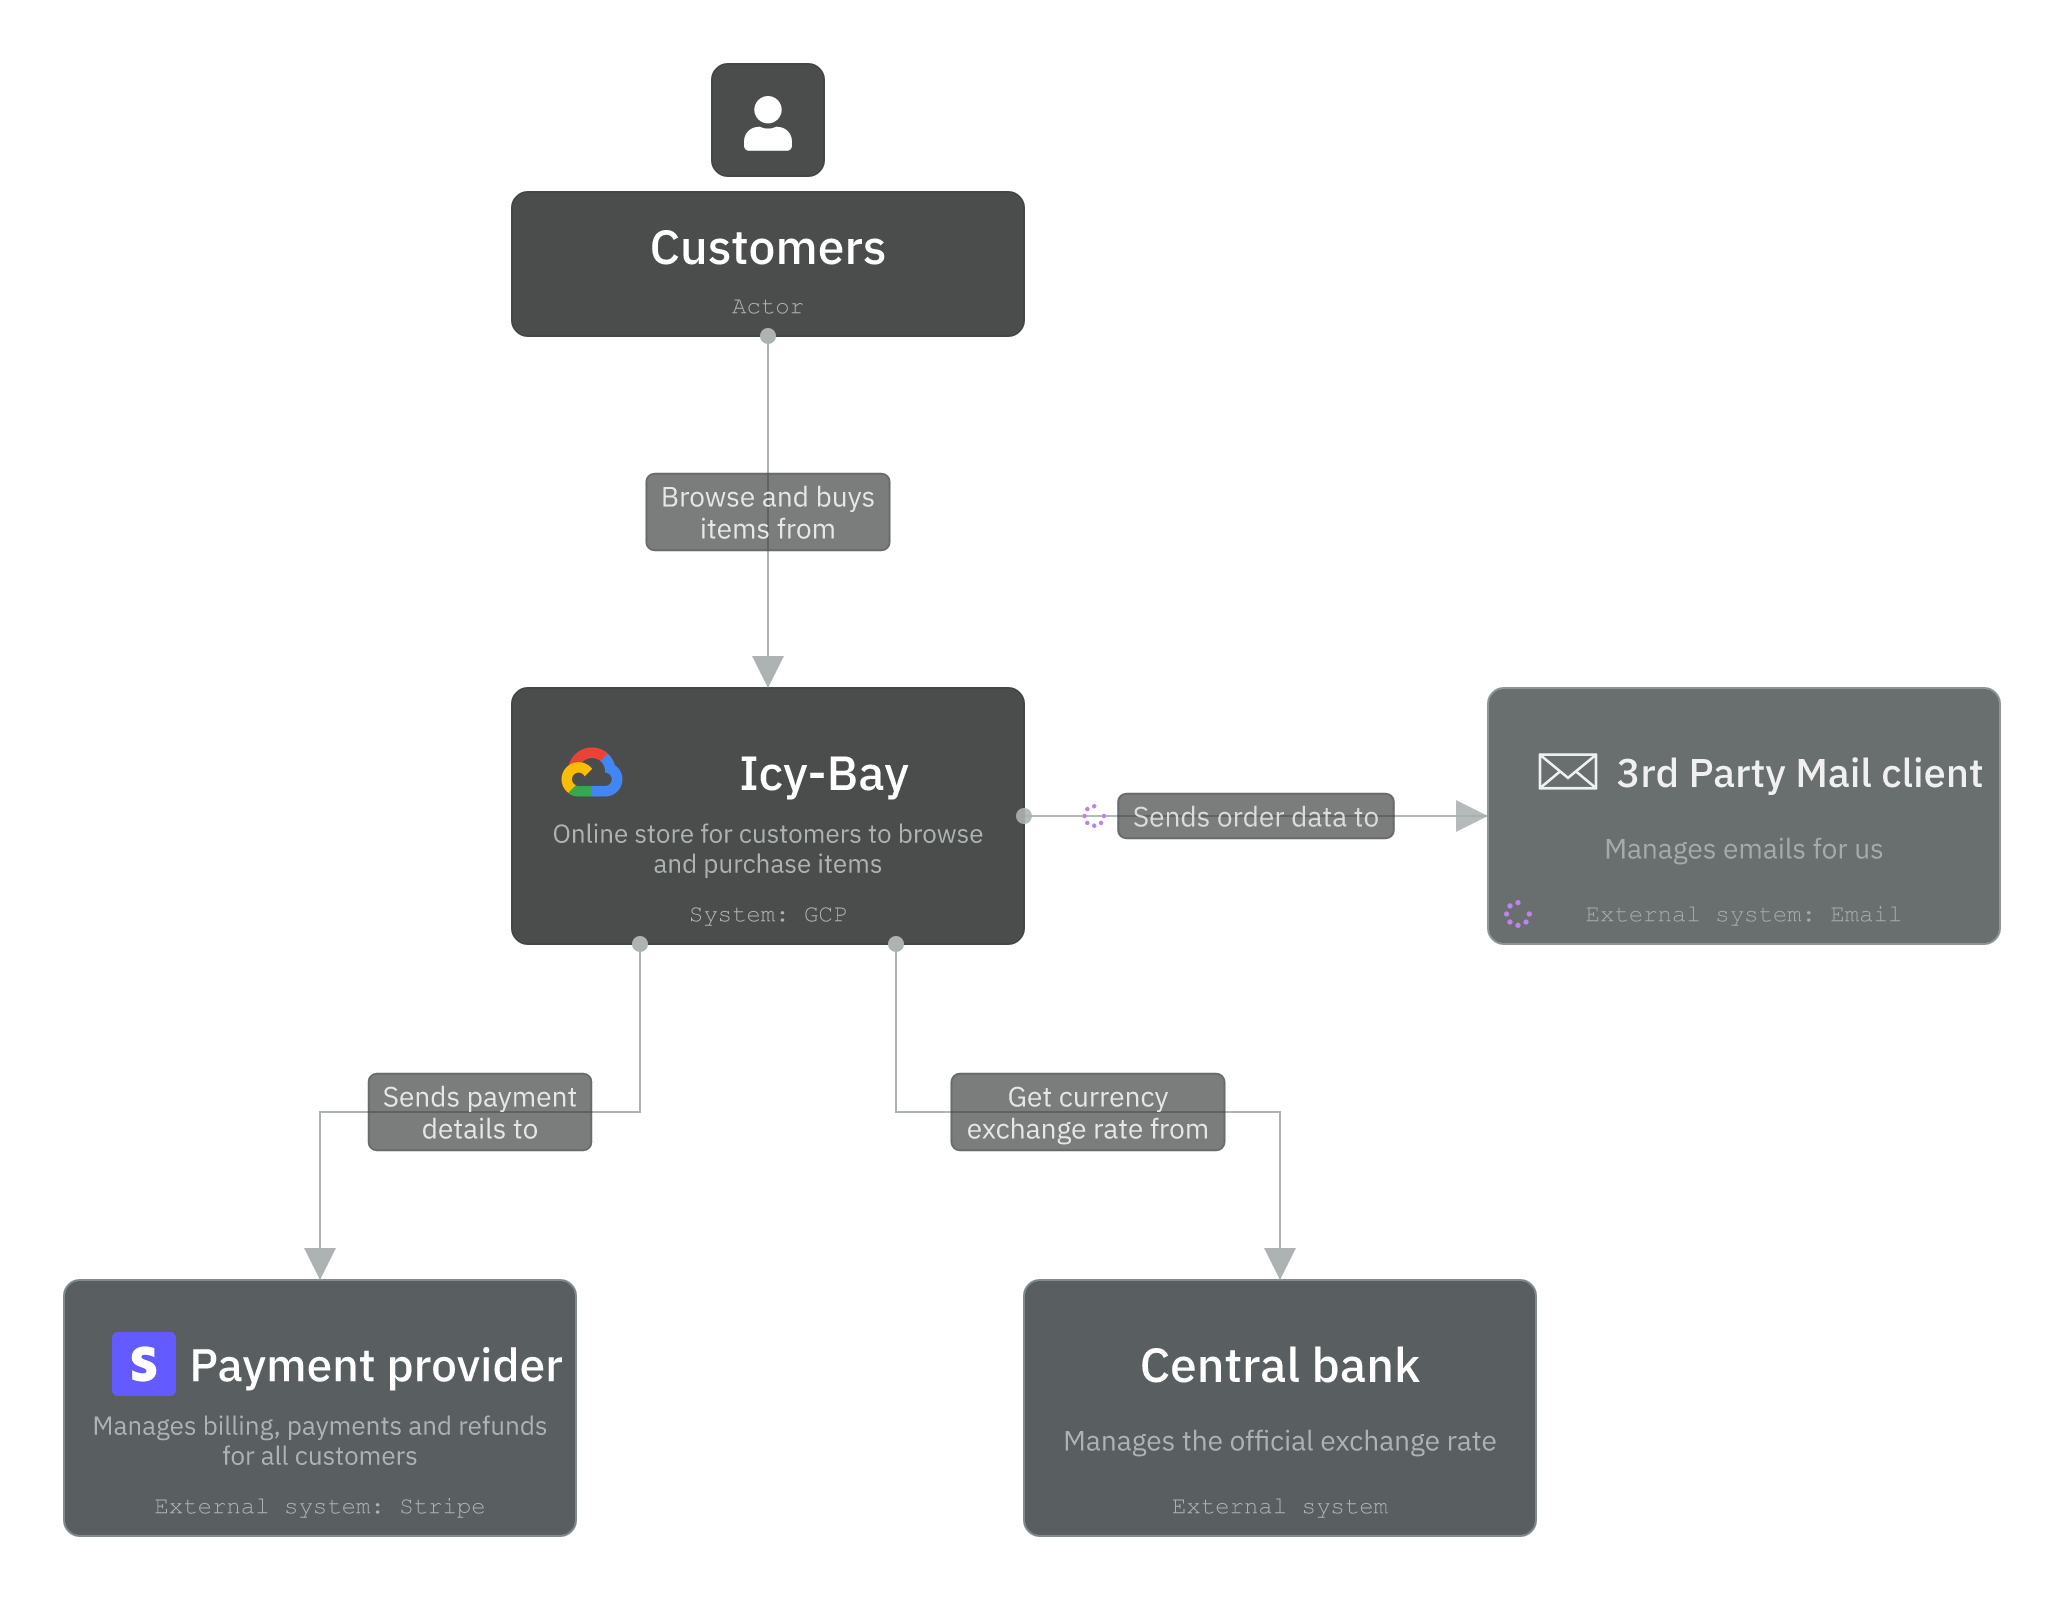
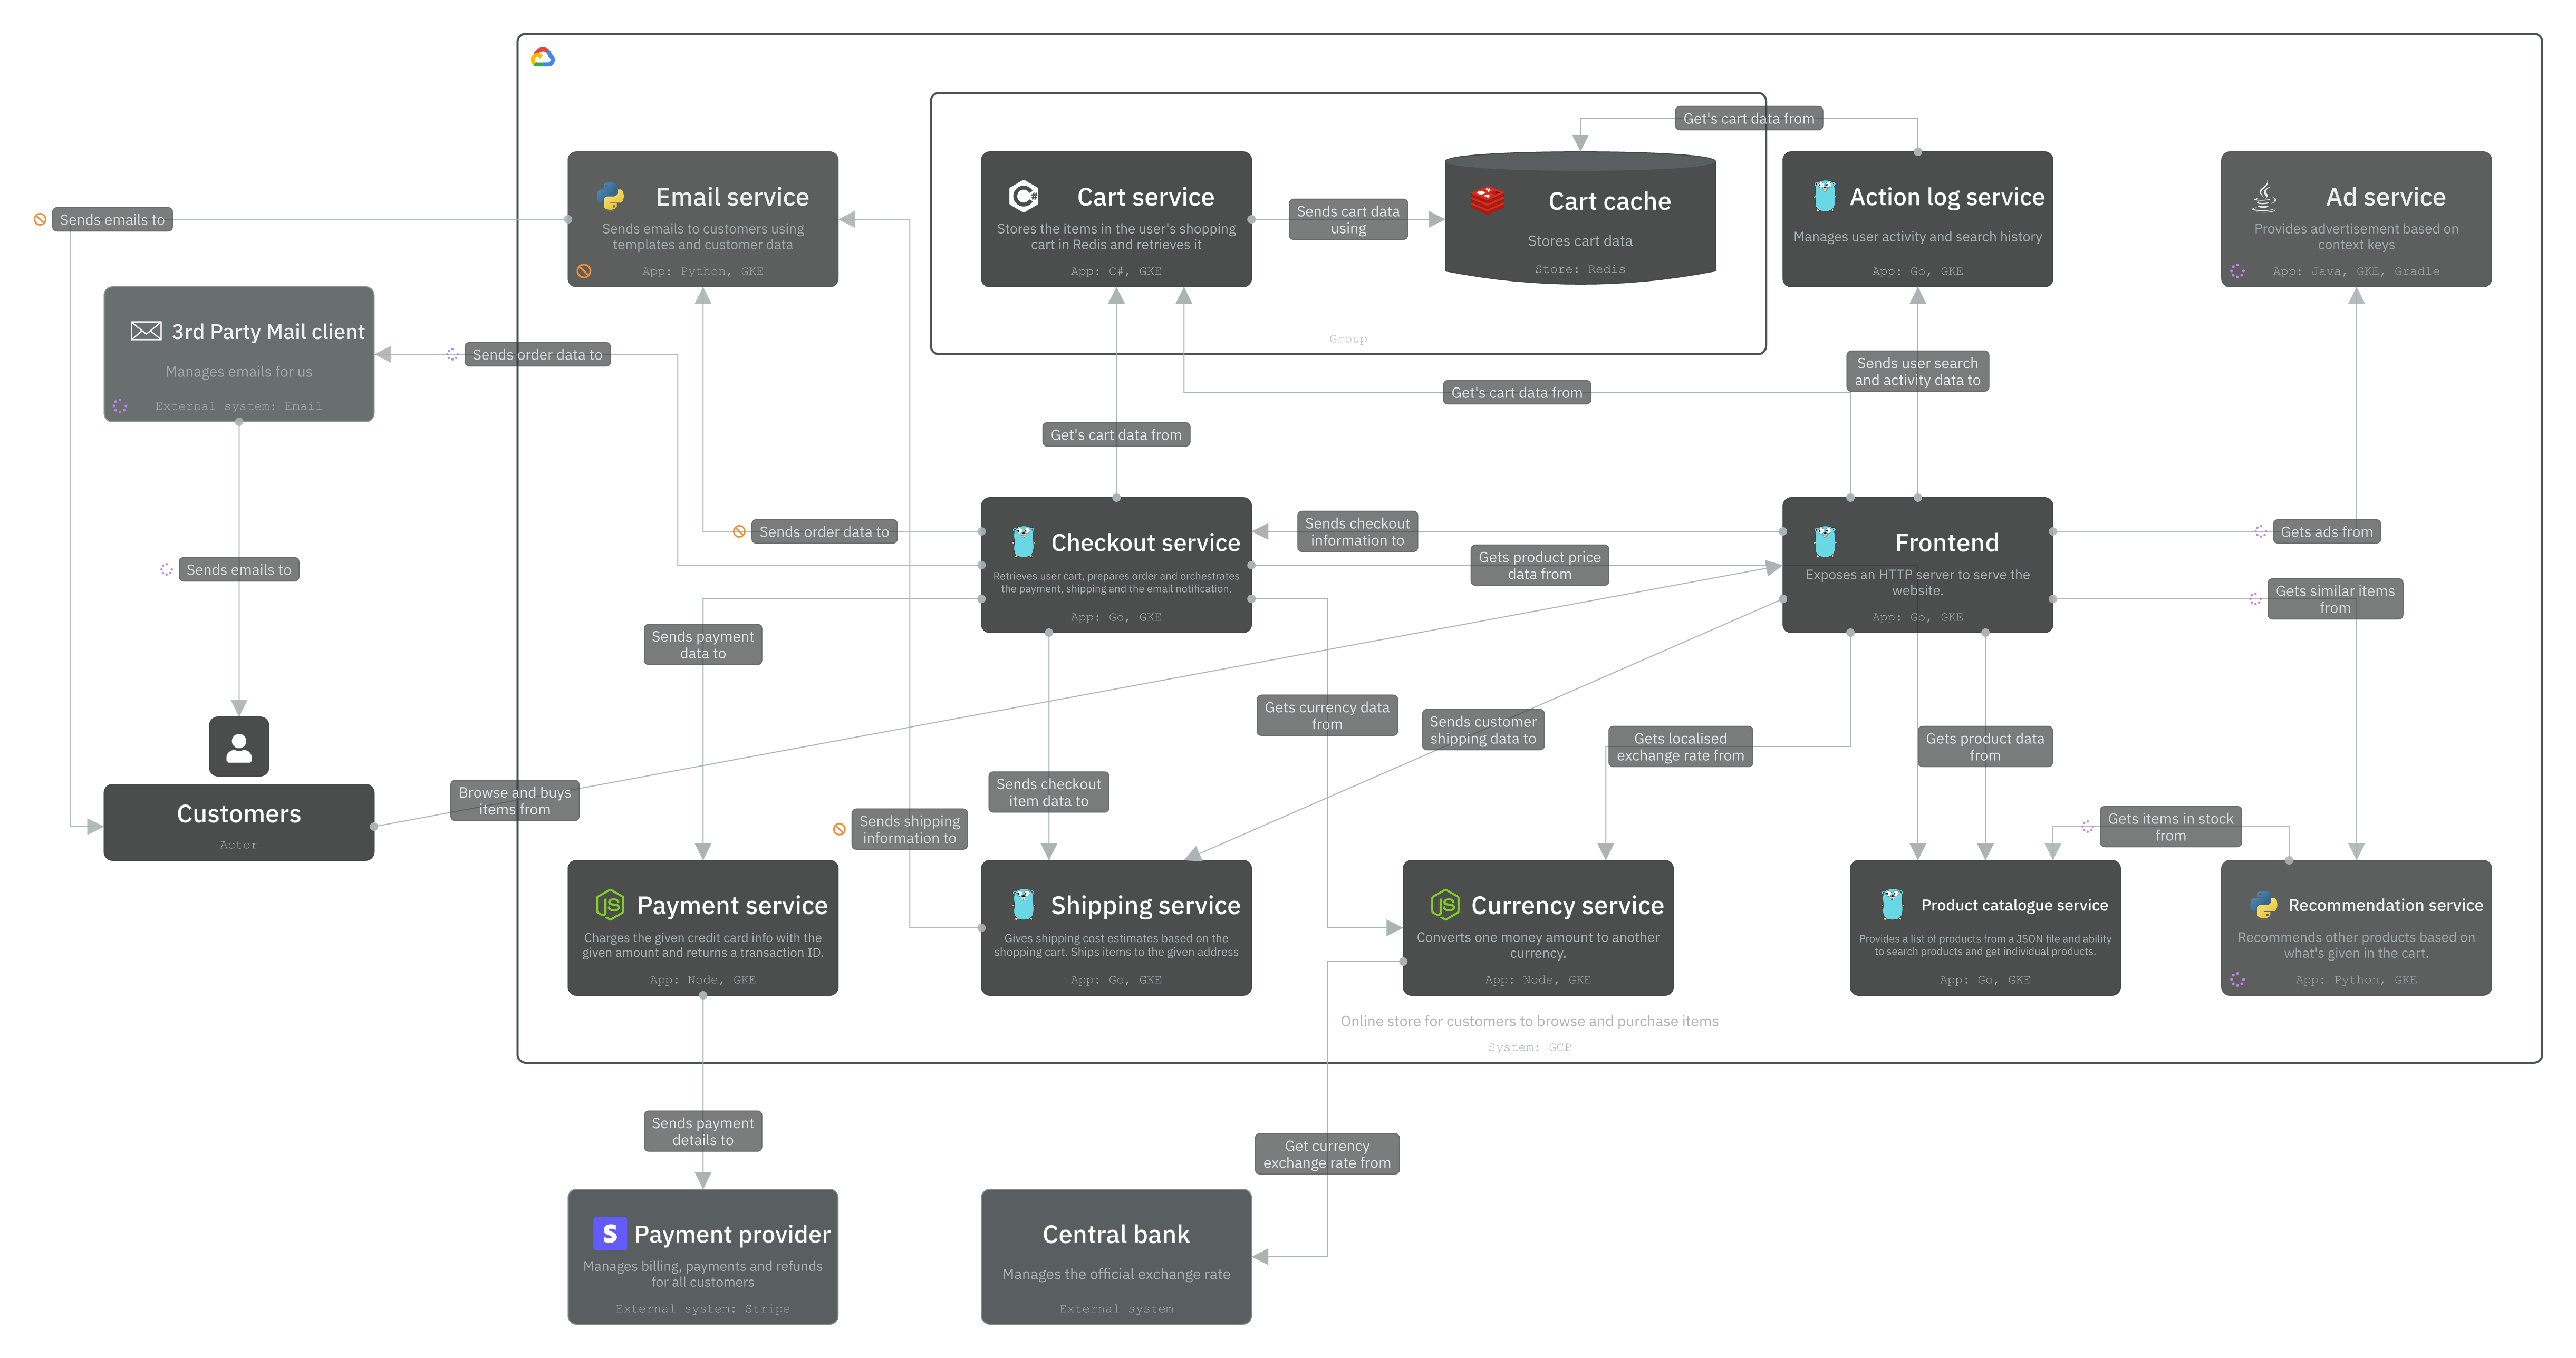
To make this concrete, let’s look at the architecture of Icy-Bay, an online store for customers to browse and purchase items. Icy-Bay runs on a microservices architecture, with integration to third-party systems like Mailing systems and payment providers.
The engineering team maintains their architecture in IcePanel. But finance doesn’t need to understand how the recommendation service talks to the product catalogue service. They need to know how much each part of the system costs to run and where the budget is going.
In IcePanel, you can use Tags to add properties to your architecture (the model). With a tagged architecture, you can use visualisation tools to show different perspectives on the same architecture without creating separate diagrams.
For Icy-Bay, the engineering team tags their model objects with properties like:
- Cost tier: High / Medium / Low, based on monthly infrastructure spend
- Cloud provider: AWS, GCP, Azure
- Region: EU-West, US-East, etc.
- Environment: Production, Staging, Development
- Product line: Payments, Recommendation, Ads
With these tags in place, the FP&A team can filter the architecture by cost tier to immediately see which services are driving the most spend. They can filter by product line to allocate infrastructure costs to the right business unit. They can cross-reference that information with their cloud bills (like AWS Cost Explorer).
For example, if FP&A is forecasting Q3 costs and wants to understand why infrastructure spending increased, they can filter by the “High” cost tier tag and see if new services were provisioned and ask engineering for input. Filtering can be applied in any diagram or the model objects list for a more catalogue-focused view.
Part of IcePanel’s DNA is collaboration, so it’s possible to leave Comments directly on the architecture. This is especially useful for FP&A. A finance team member can drop a question directly on a service asking about its cost breakdown, mention the relevant engineer, and get a threaded answer in context.
Being able to comment on a living model is better than an outdated diagram or a Slack thread.
And finally, all the model data (objects, flows, tags, etc.) can be exported as JSON, CSV, and other formats. For finance teams who work with Excel sheets religiously, this means they can select objects from the model with fields they’re interested in (e.g., Teams, Tags, Technology, Status, etc.) and export them into spreadsheets and merge with other billing data for a holistic view of their business spend.
For cost analysis, finance teams can leverage LLMs by connecting to IcePanel’s MCP server. This provides a chat-like interface for asking questions about the model, getting insights, and performing write operations like updating selected objects. For the scope of FP&A, read operations and recommendations from the LLMs would be enough to develop a good financial model.
Conclusion
Architecture shouldn’t be a black box for the people funding it. FP&A teams make better decisions when they can see the systems they’re budgeting for. IcePanel makes that possible without requiring finance teams to learn how to read technical diagrams or chase engineers. The key element is collaboration. Allowing teams to work collaboratively on the architecture: tag or comment on user flows or services, create specific views of the architecture, and create shareable links to the diagrams. All of that makes it easier for FP&A to do their job.
Let us know how often your teams collaborate with finance!
📚 Resources
- https://docs.icepanel.io/core-features/model-viewer
- https://docs.icepanel.io/visual-storytelling/perspective-tags
- https://docs.icepanel.io/templates/e-commerce
- https://docs.icepanel.io/collaboration/commenting
- https://docs.icepanel.io/collaboration/sharing
- https://docs.icepanel.io/core-features/export
- https://docs.icepanel.io/integrations/mcp-server