📝 Introduction
In this post, we’ll design a Metrics Monitoring and Alerting System that engineers use for their infrastructure observability and maintenance health. The industry standard for this system is a combination of two technologies: Prometheus (metrics collection, storage, and alerting) and Grafana (visualisation). We’ll break down the problem, establish scope, and design the system as software architects. We’ll also create four hierarchical diagrams: Context, Container, Component, and Code (not familiar with these? Read this).
Each diagram will be annotated to explain the key building blocks and responsibilities, and we’ll highlight how users interact with the system by visualising data flow using IcePanel Flows.
We’ll start by defining the scope of the system through its functional requirements (what the system does) and non-functional requirements (the qualities it should have). From there, we’ll progressively go through each layer of the C4 model to build the overall architecture.
You can view the final architecture at this link: https://s.icepanel.io/DWnaysJ3cbCQqg/IlDZ
🔎 Scope
A well-designed monitoring and alerting system plays a key role in providing visibility into the health of a system’s infrastructure. This is crucial for engineers who want to ensure high availability and reliability of their systems. This will be factored into our non-functional requirements.
First, we define what we mean by metrics in this post:
- Infrastructure metrics: Operational system metrics that contain low-level usage data such as CPU load, memory usage, and disk space.
- Software metrics: Service-level metrics containing higher-level data like requests per second, request latency, or number of running servers in a cluster.
- Business metrics: This is outside the scope of this post. We’ll focus on infrastructure and software metrics.
The functional requirements for this system are:
- Engineers should be able to query data sources (Prometheus) and view real-time dashboards and metrics (Grafana).
- The system should evaluate alert rules (Prometheus) against metrics and page on-call engineers when rules have been breached.
The non-functional requirements for this system are:
- Highly scalable. Our metrics collection pipeline should accommodate growing metrics and alert volume. Let’s quantify it as 100 server pools and 100 machines per pool, scraping ~100 metrics per machine every 10 seconds. Roughly 100,000 data points / second or ~8.6 billion data points per day! This estimate describes a write-heavy system.
- Low latency. Viewing dashboards should reflect near real-time metrics. Engineers should not miss any fired alerts.
- Availability >> consistency. Losing a few data points is tolerable. However, the system must be available 24/7, especially for alerts.
We’ll intentionally leave log monitoring (ELK stack) and distributed tracing outside of scope.
Let’s start with the first diagram, Context.
Level 1 - Context
The Context layer defines the actors and external systems we depend on. In this design, we have one actor and three external systems:
- Engineer (Actor): Monitors system health by querying metrics and viewing dashboards. This includes software engineers, on-call responders, platform, and SREs. They also get notified by alerts from the system in case a predefined threshold was breached.
- AWS CloudWatch (System): An AWS monitoring service that collects metrics from cloud infrastructure and managed services. Our system pulls infrastructure metrics from CloudWatch to surface them alongside application metrics. If you’re interested to learn more, this is implemented by a CloudWatch exporter (read here).
- Monitored Services (System): Self-instrumented applications, databases, and message queues that expose a /metrics HTTP endpoint for our system to pull. Our system scrapes them directly using Prometheus’s pull model.
- PagerDuty (System): An incident management platform that receives triggered alerts from our system. It routes them to the on-call engineer. Other notification channels (Email, Slack, SMS) are also supported but abstracted away for simplicity.
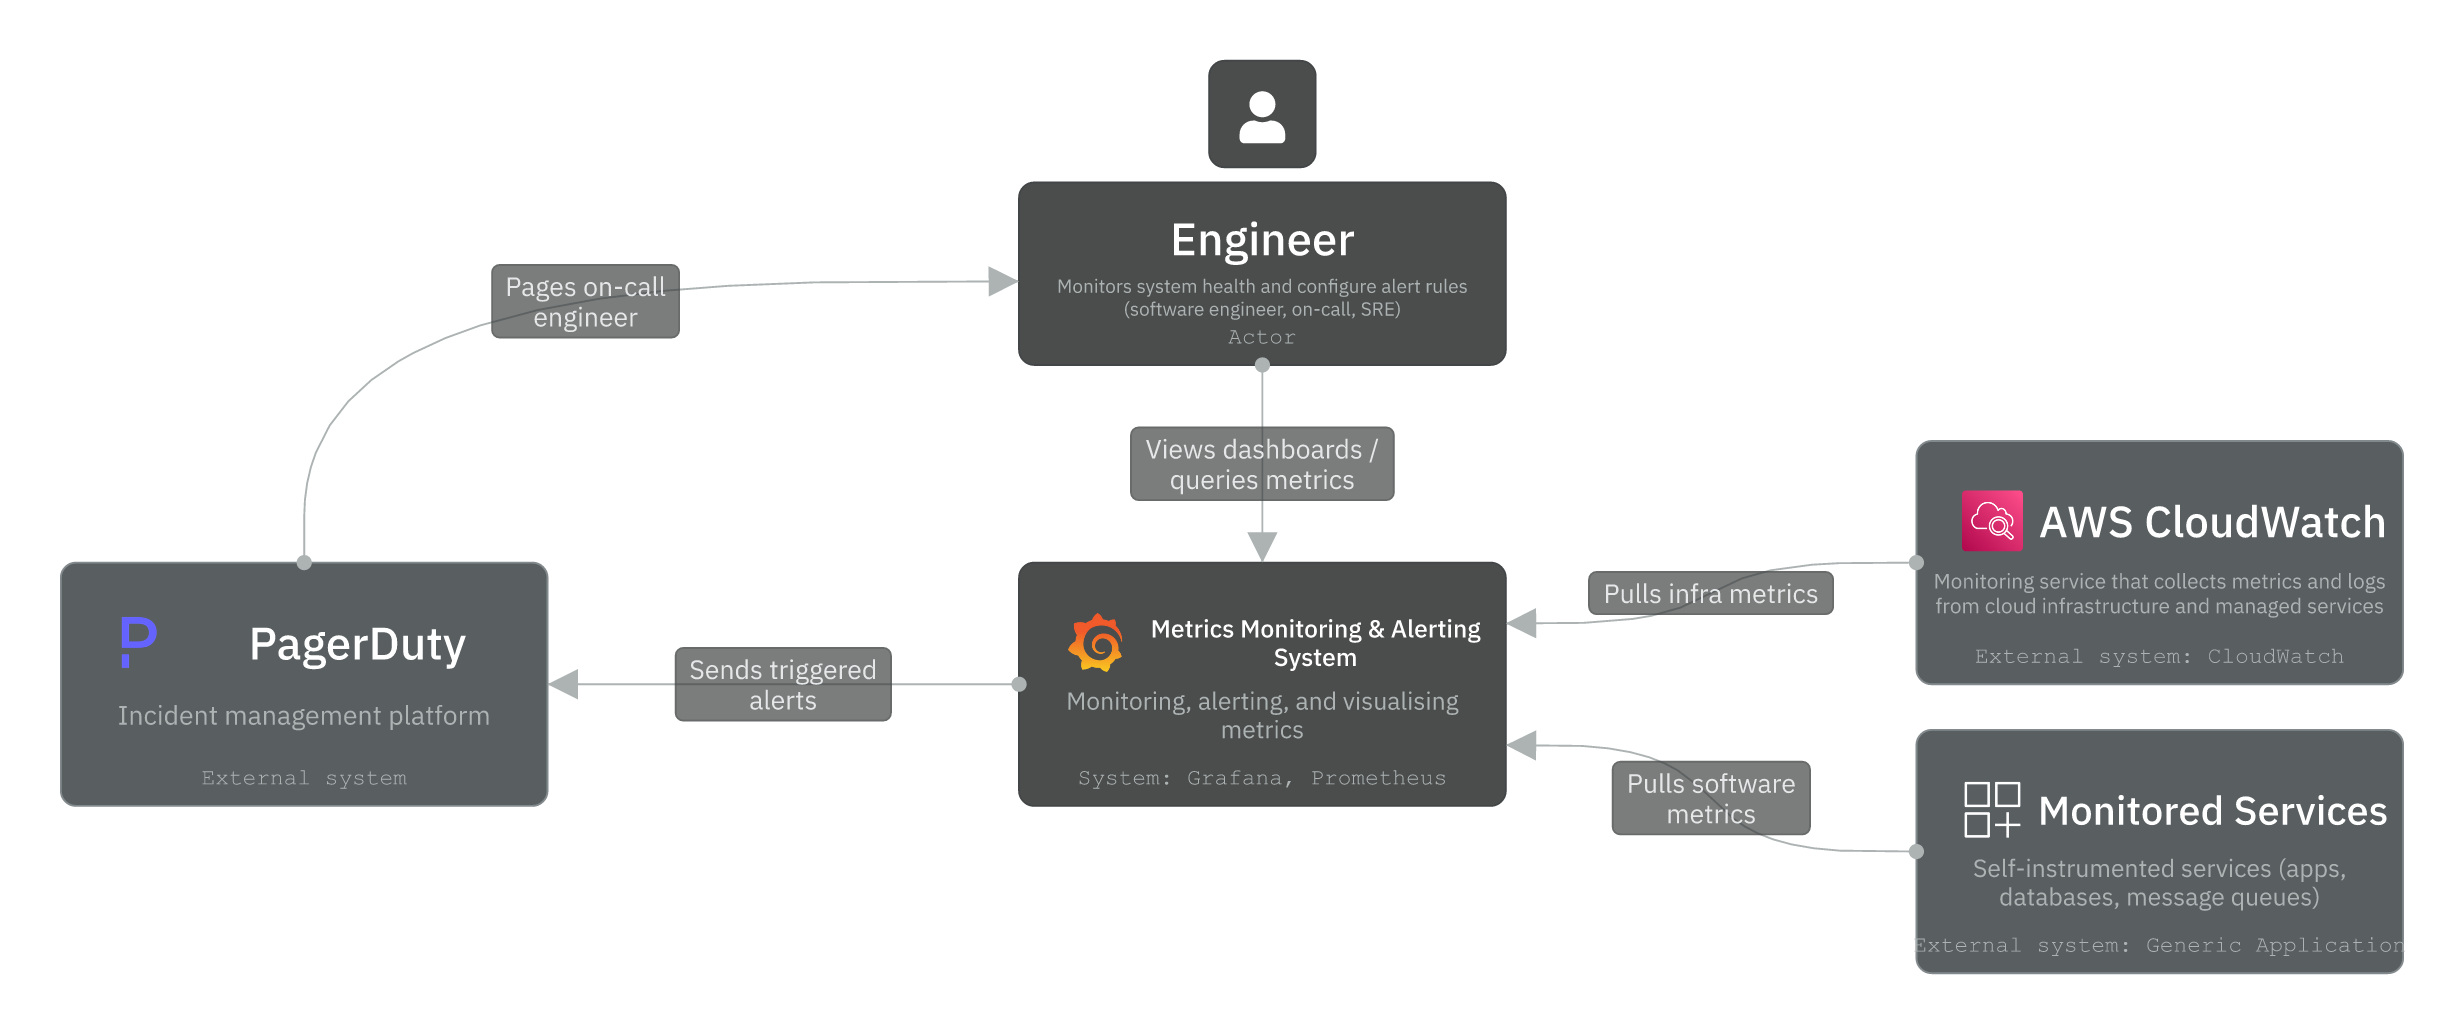
Prometheus and Grafana are not visible yet in this Context view. They live inside the system boundary, which we’ll cover next in the Container diagram.
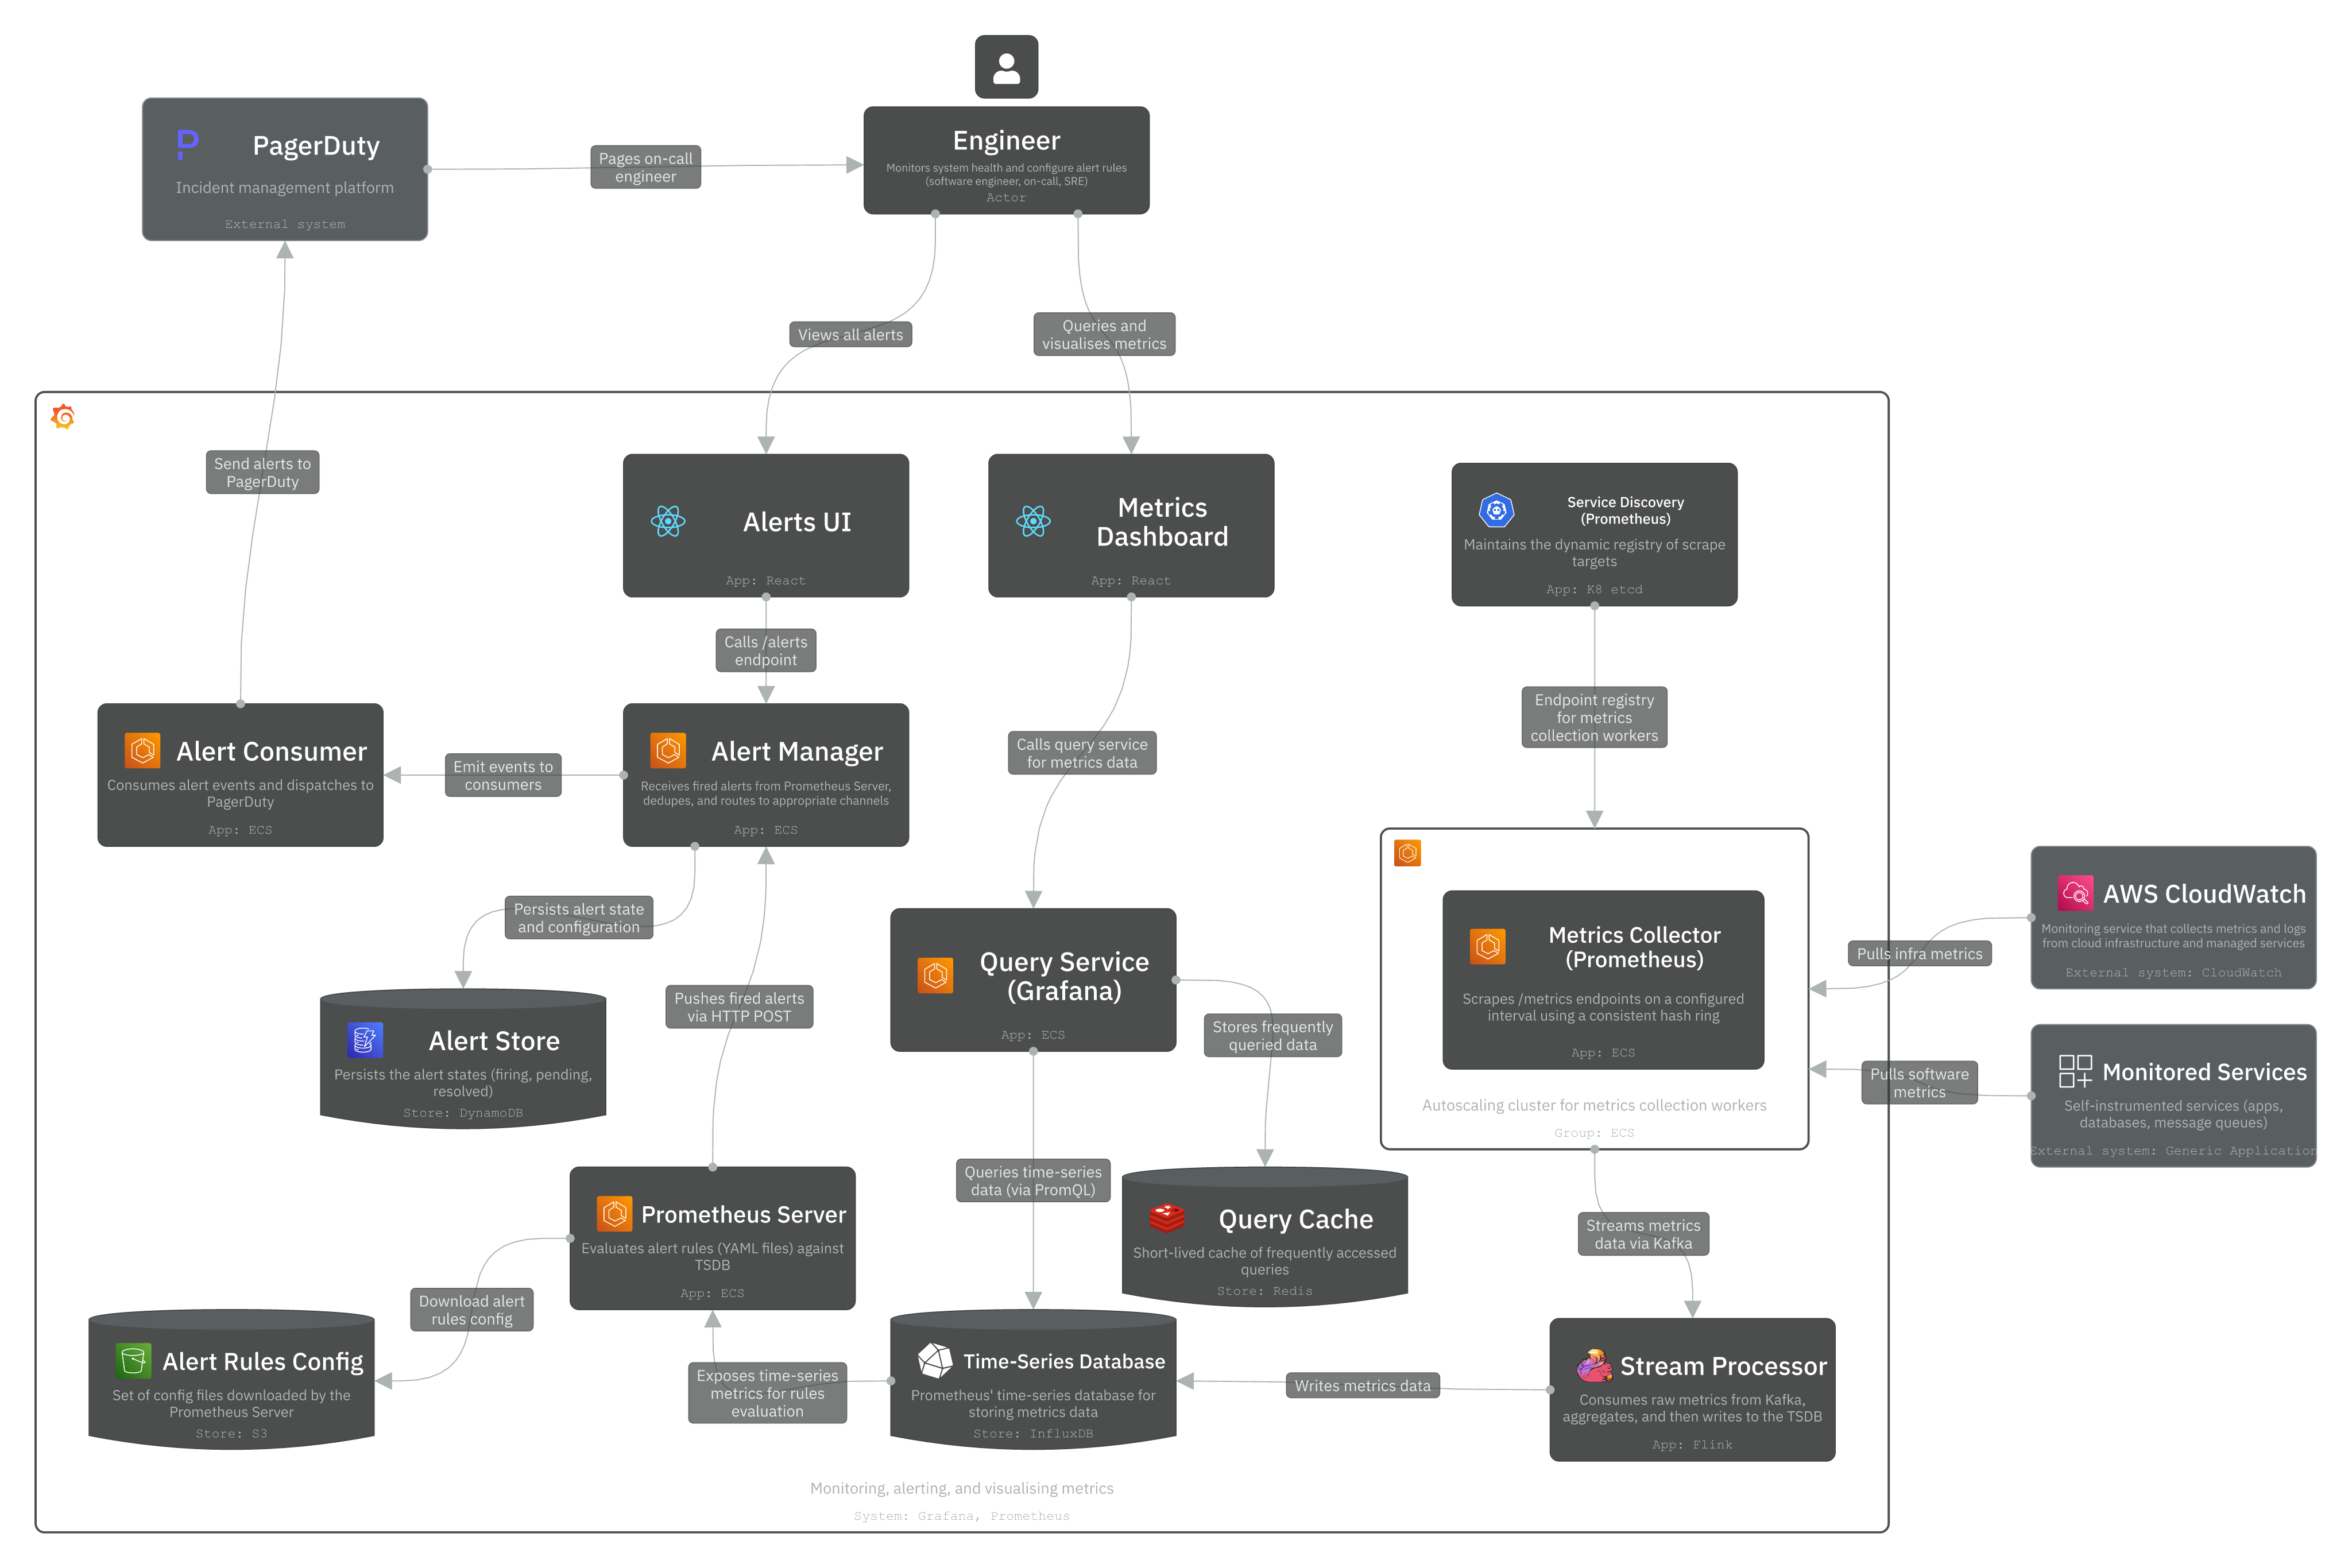
Level 2 - Container
The Container layer models independently deployable applications, services, and data stores. We use a microservices architecture to independently scale certain workloads and provide high availability and performance as defined in the non-functional requirements. This is a write-heavy system (100k data points / second) with spiky reads (metrics queries or dashboards refreshing every X seconds). This write-heavy pattern directly shapes the architecture decisions in the Container layer below.
The system is composed of three main parts:
1. Metrics collection:
- Metrics Collector Pool (ECS Autoscaling): Pool of metrics collectors that pull /metrics endpoints from monitored services on a configured interval (e.g., 10 seconds). These collectors are distributed across targets using a consistent hash ring to avoid duplicate data collection.
- Service Discovery (etcd / Zookeeper): A coordination component that maintains the dynamic registry of scrape targets. It notifies the Metrics Collector Pool when monitored services are added or removed so collectors always know what to scrape.
- Message Queue (Kafka): Receives raw metrics from the Collector Pool and buffers them before processing. Decouples collection from storage and prevents data loss when the TSDB is unavailable. Partitioned by metric name and label for parallel consumption.
- Stream Processor (Flink): Consumes raw metrics from Kafka, aggregates and processes them, then writes to the TSDB. Handles late-arriving data and reduces write volume through pre-aggregation.
- Time-Series Database (InfluxDB): A time-series database (TSDB) that stores all metrics as time-series data with label-based indexing. It provides optimisation features for time-series data like downsampling and data compression.
2. Alerting:
- Prometheus Server (ECS): Evaluates alert rules defined in YAML config files against the TSDB on a configured interval. Pushes fired alerts to Alertmanager via HTTP POST.
- Alert Manager (ECS): Receives fired alerts from Prometheus Server. Deduplicates, groups, and routes them to Alert Consumers via Kafka.
- Alert Store (DynamoDB): Persists alert state (inactive → pending → firing → resolved) to ensure at-least-once delivery across restarts and retries.
- Alert Consumer (ECS): Pulls alert events from Kafka and dispatches notifications to PagerDuty, Slack, Email, or HTTP endpoints.
3. Visualisation and querying:
- Alerts UI (React): Frontend for engineers to view firing alerts and manage silences via the Alertmanager API.
- Metrics Dashboard (React / Grafana Frontend): A UI for engineers to query and visualise time-series metrics via the Query Service.
- Query Service (ECS / Grafana Backend): Receives query requests (via PromQL) from the Metrics Dashboard, checks Redis for cached results, and falls back to the TSDB on a cache miss.
- Query Cache (Redis): Caches frequently accessed query results to reduce repeated read load on the TSDB.
How the system works
The system operates across two parallel pipelines (metrics collection pipeline and alerting pipeline), which share the TSDB as the ground-truth datastore.
Metrics pipeline: The Metrics Collector Pool scrapes these /metrics endpoints with Service Discovery (zookeeper/etcd) managing the target list dynamically. Scraped metrics are written to Kafka, consumed by the Stream Processor (Flink), and written to the TSDB. When engineers query dashboards, the Metrics Dashboard sends PromQL requests to the Query Service, which checks the Redis cache first, and falls back to the TSDB on a cache miss.
Alerting pipeline: The Prometheus Server evaluates alert rules from YAML config files against the TSDB every evaluation interval (e.g., 10 seconds). When a threshold is breached, Prometheus Server pushes the alert to Alert Manager via HTTP POST. Alert Manager deduplicates alerts, routes them to the dispatcher, dispatches to consumers (via Kafka), and persists its state to DynamoDB. Alert Consumers pull from Kafka and dispatch notifications to PagerDuty, Email, Slack, or HTTP endpoints. PagerDuty then pages the on-call engineer.
Data flows
We’ve designed two primary data flows using IcePanel. Check them out and see how the system works.
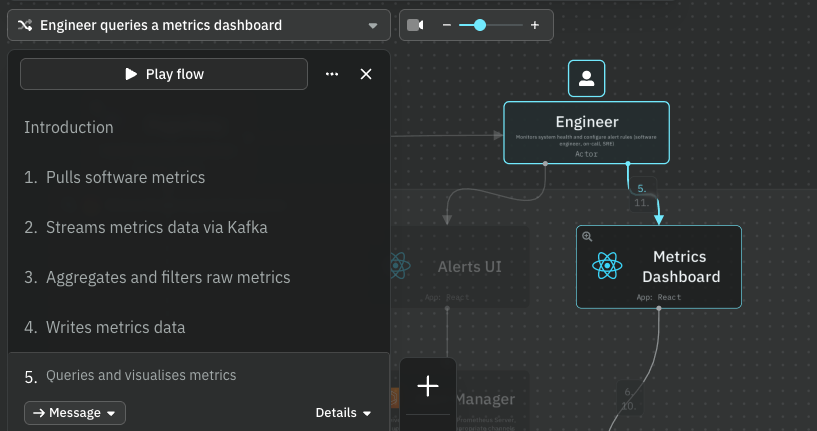
Flow 1: Engineer queries a metrics dashboard
Complete flow: https://s.icepanel.io/DWnaysJ3cbCQqg/Jvuo
- Engineer opens the Metrics Dashboard (Grafana UI)
- React app sends HTTP GET with a PromQL query to the Query Service
- Query Service checks Redis. Cache hit returns immediately; cache miss executes against TSDB
- Time-series data is returned and rendered as charts
Flow 2: Alert fires and pages the on-call engineer
Complete flow: https://s.icepanel.io/DWnaysJ3cbCQqg/342p
- Prometheus Server evaluates an alert rule against the TSDB
- Prometheus Server pushes alert to Alertmanager via HTTP POST
- Alert event published to Kafka
- Alert Consumer dispatches notification to PagerDuty
- PagerDuty pages the on-call engineer
Before going into level 3 (Component), there are a few key architectural decisions worth discussing. We’ll go through the data model, storage, and push vs pull models.
Data Model
Metrics data is recorded as time-series data: a set of values with associated timestamps, uniquely identified by a metric name and optional tags. For example:
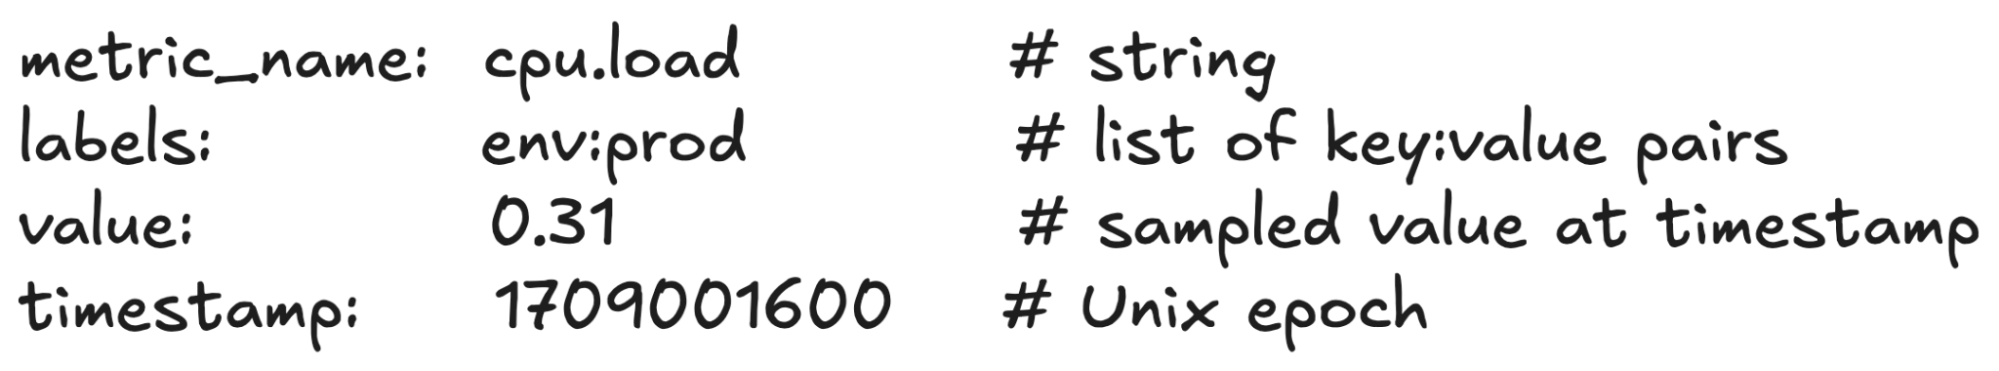
An engineer might want to query the system to answer questions like:
- What is the CPU load on the production server at 18:00?
- What is the average memory load across all Redis caches for the last 6 hours?
- What is the total number of requests to our API in the last hour?
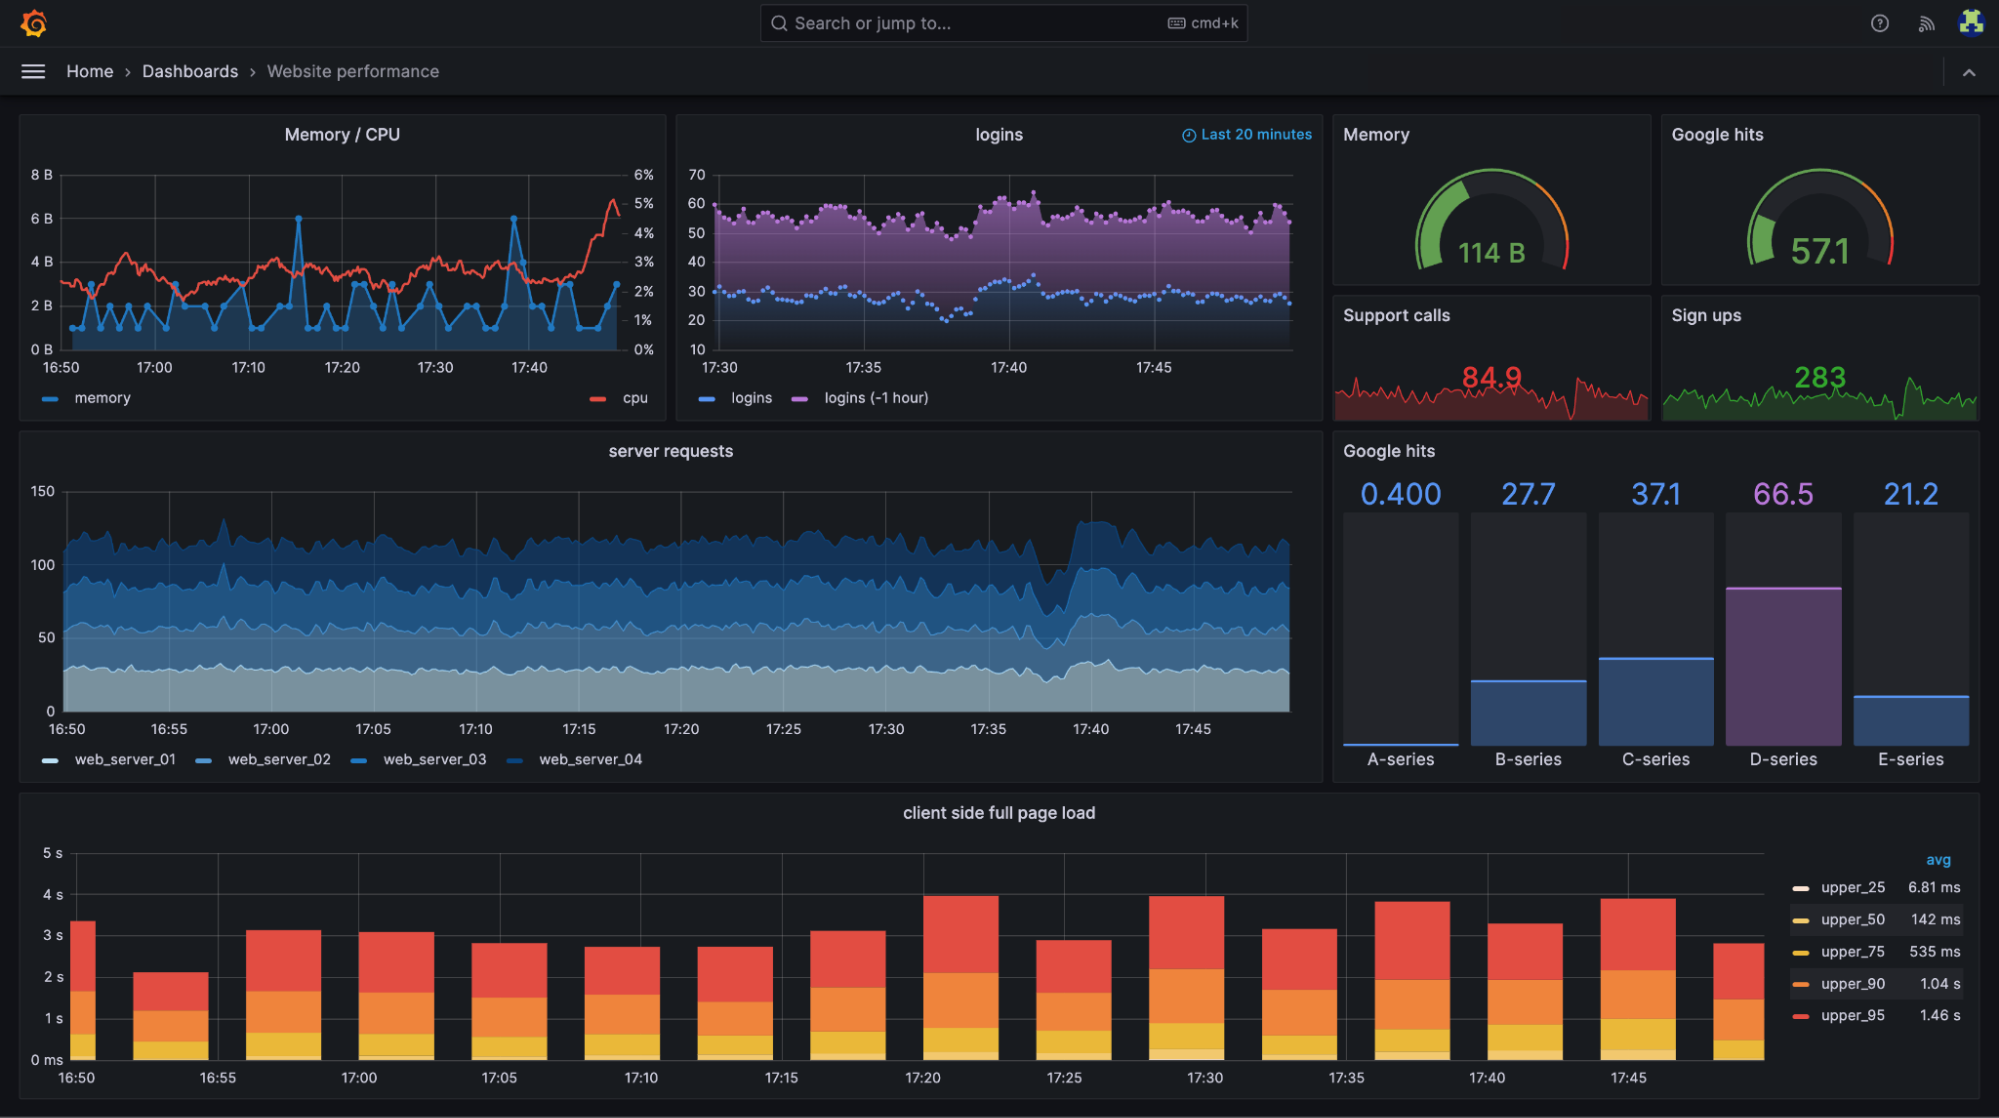
Here’s an example Grafana dashboard showing real-time website performance metrics like memory and CPU usage, server requests, login activity, and client-side page load times broken down by percentile (source).
Selecting a database storage
In theory, a general-purpose database could support time-series data, but it would require expert-level tuning to make it work at our scale. For example, a SQL database like PostgreSQL is not optimised for operations you would commonly perform against time-series data. NoSQL is another choice. Cassandra can be used for time-series data. However, this would still require expert NoSQL knowledge to design a scalable schema for storing and querying time-series data.
For this problem, we’ll need a storage system optimized for time-series data. AWS has Timestream as a managed time-series database. According to DB-engines, the two most popular ones are InfluxDB and TimescaleDB, which are designed to store large volumes of time-series data and quickly perform real-time analysis on that data. Both of them primarily rely on an in-memory cache and on-disk storage. They both handle durability and performance quite well. For this example, we’ll pick InfluxDB. There was a previous benchmark that reported InfluxDB with 8 cores and 32GB RAM can handle over 250k writes per second, which fits well within our requirements.
Pull vs Push model
There are two ways metrics data can be collected. In a pull model, dedicated collectors scrape /metrics endpoints from running applications on a configured interval. In a push model, a collection agent is installed on every monitored server as a sidecar container. Examples of push architecture are Amazon CloudWatch and Graphite.
Prometheus uses a pull model. The collector scrapes targets rather than targets pushing to the collector. This is deliberate: it makes the collector the source of truth for what’s being monitored, enables easier debugging (you can curl any /metrics endpoint directly), and allows Service Discovery to manage the target list centrally.
For our design, we use the pull model as the primary path. CloudWatch metrics enter via the CloudWatch Exporter, which translates the CloudWatch API format into the standard /metrics format that Prometheus can scrape.
Level 3 - Component
In the C4 model, a component is a grouping of related functionality encapsulated behind a well-defined interface. We’ll zoom into three components: Prometheus Server, Alert Manager, and Query Service.
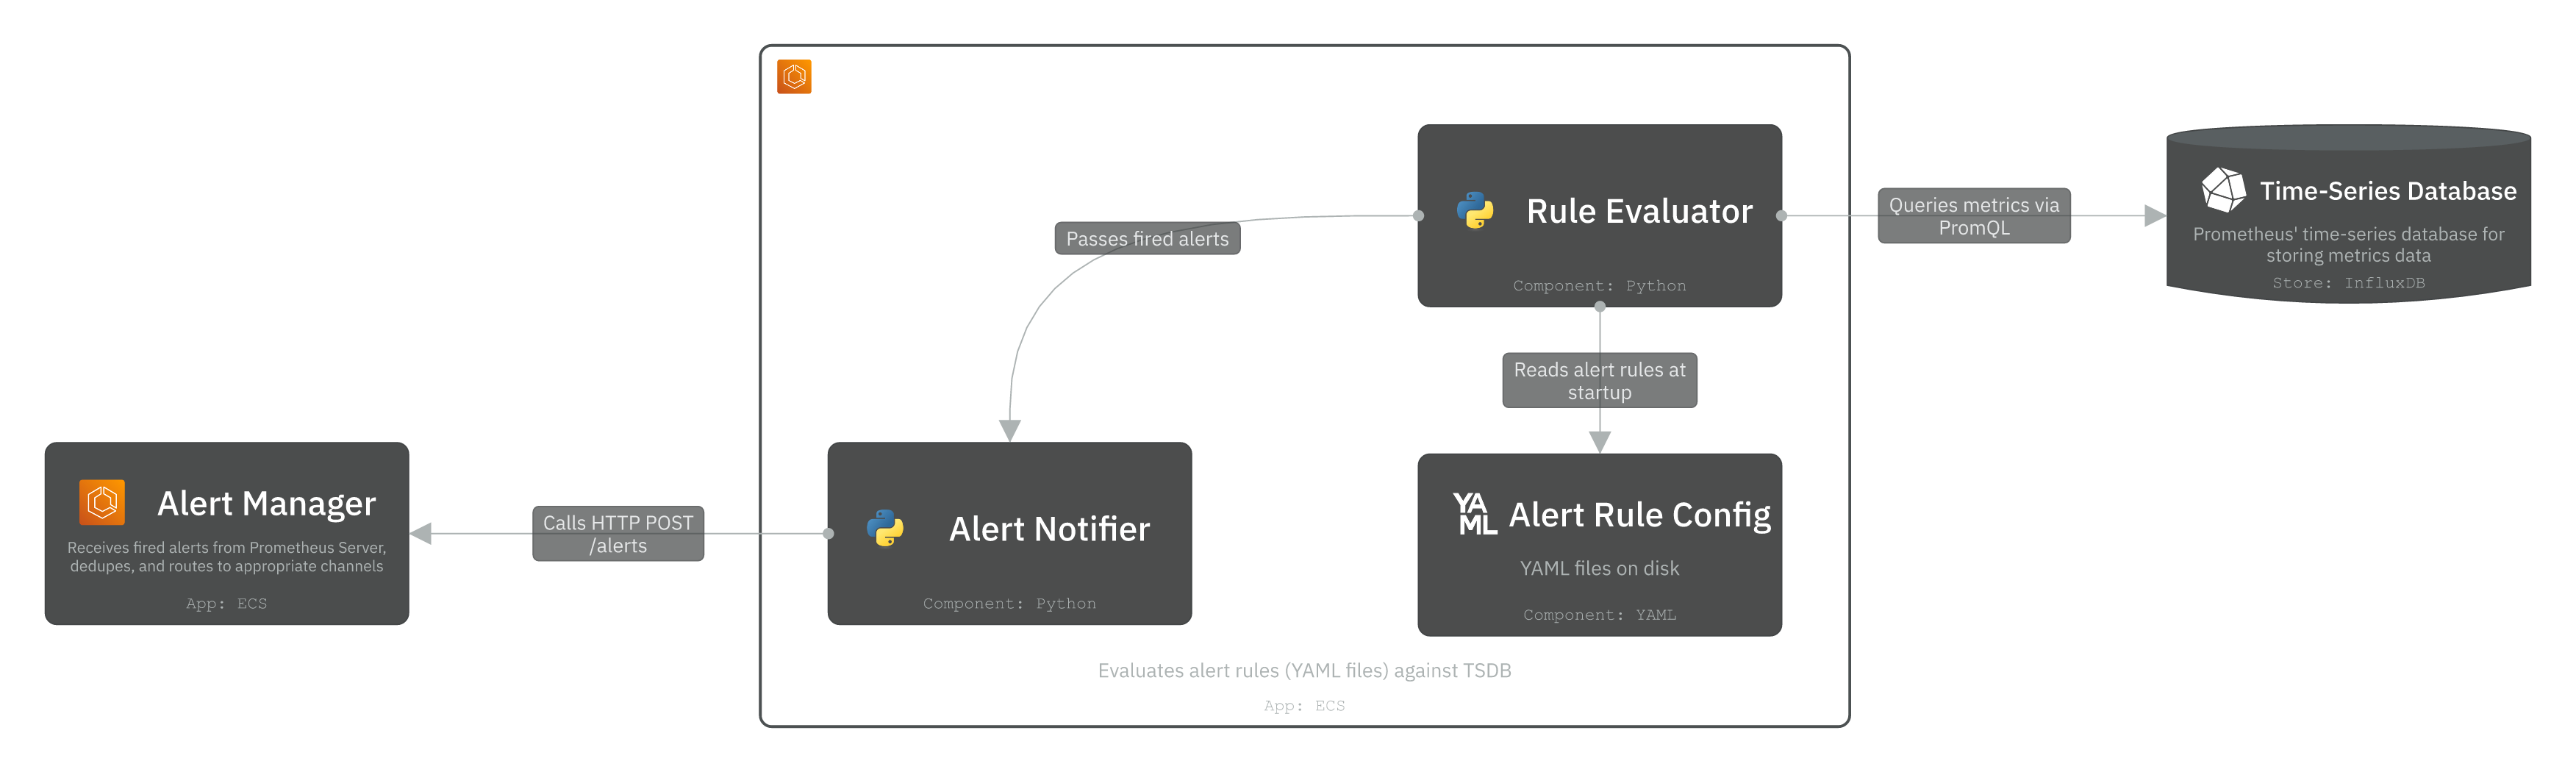
1. Prometheus Server
Prometheus Server queries the TSDB directly via PromQL to evaluate alert rules and detect threshold violations. It primarily consists of:
Rule Evaluator: A module that reads alert rules from YAML config files (stored in S3 and downloaded at startup). On every evaluation interval, it executes PromQL queries against the TSDB and compares results against defined thresholds. If a breach persists for the configured duration, it marks the alert as firing and passes it to the Notifier.
Notifier: A module that receives fired alerts from the Rule Evaluator. It pushes fired alerts to the Alert Manager via HTTP POST /api/v1/alerts, where they are deduplicated, dispatched, and persisted.
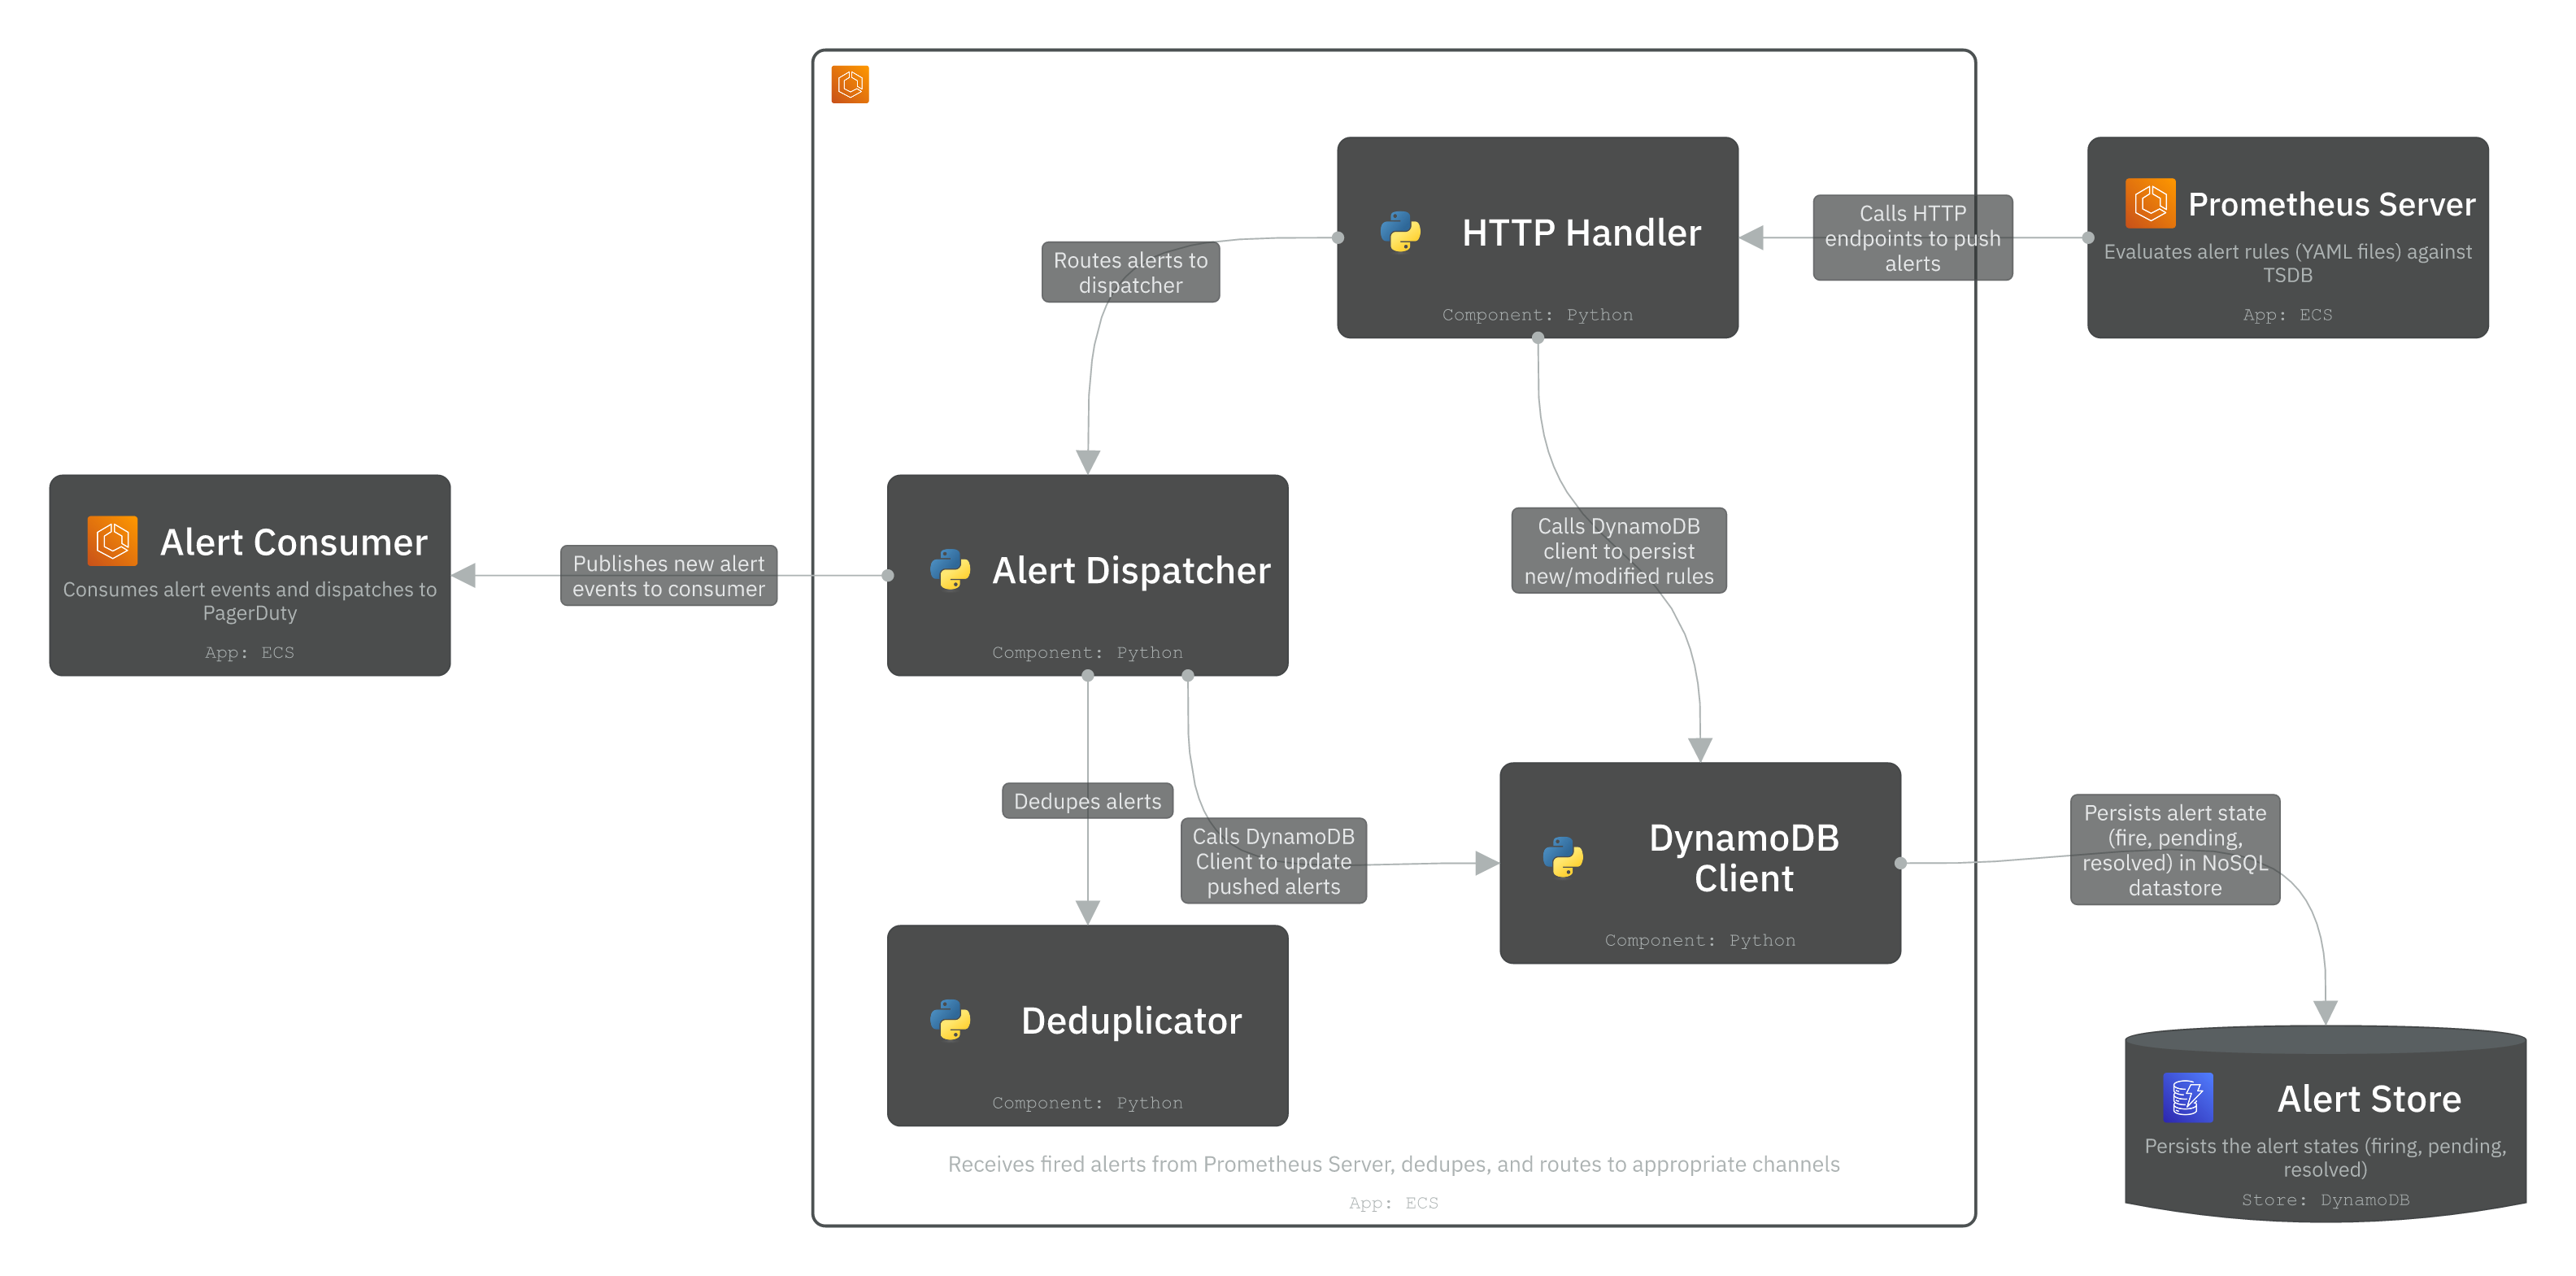
2. Alert Manager
The Alert Manager receives fired alerts from Prometheus Server and handles the full routing, deduplication, and dispatch lifecycle. It consists of four main modules:
HTTP Handler: Receives the fired alerts via HTTP POST from Prometheus Server and provides GET endpoints to serve the Alerts UI for engineers to view firing alerts and manage silences.
Deduplicator: Suppresses duplicate alerts from the handler. If the same alert fires multiple times within a grouping window, it is collapsed into a single notification to prevent spamming the notification channels.
Alert Dispatcher: Assembles the final alert event and routes it downstream. It publishes the alert event to Kafka for consumption by Alert Consumers.
DynamoDB Client: Persists the alert state transitions (inactive → pending → firing → resolved) to the Alert Store (DynamoDB). It ensures the system can resume correctly across restarts and guarantees at-least-once delivery across retries.
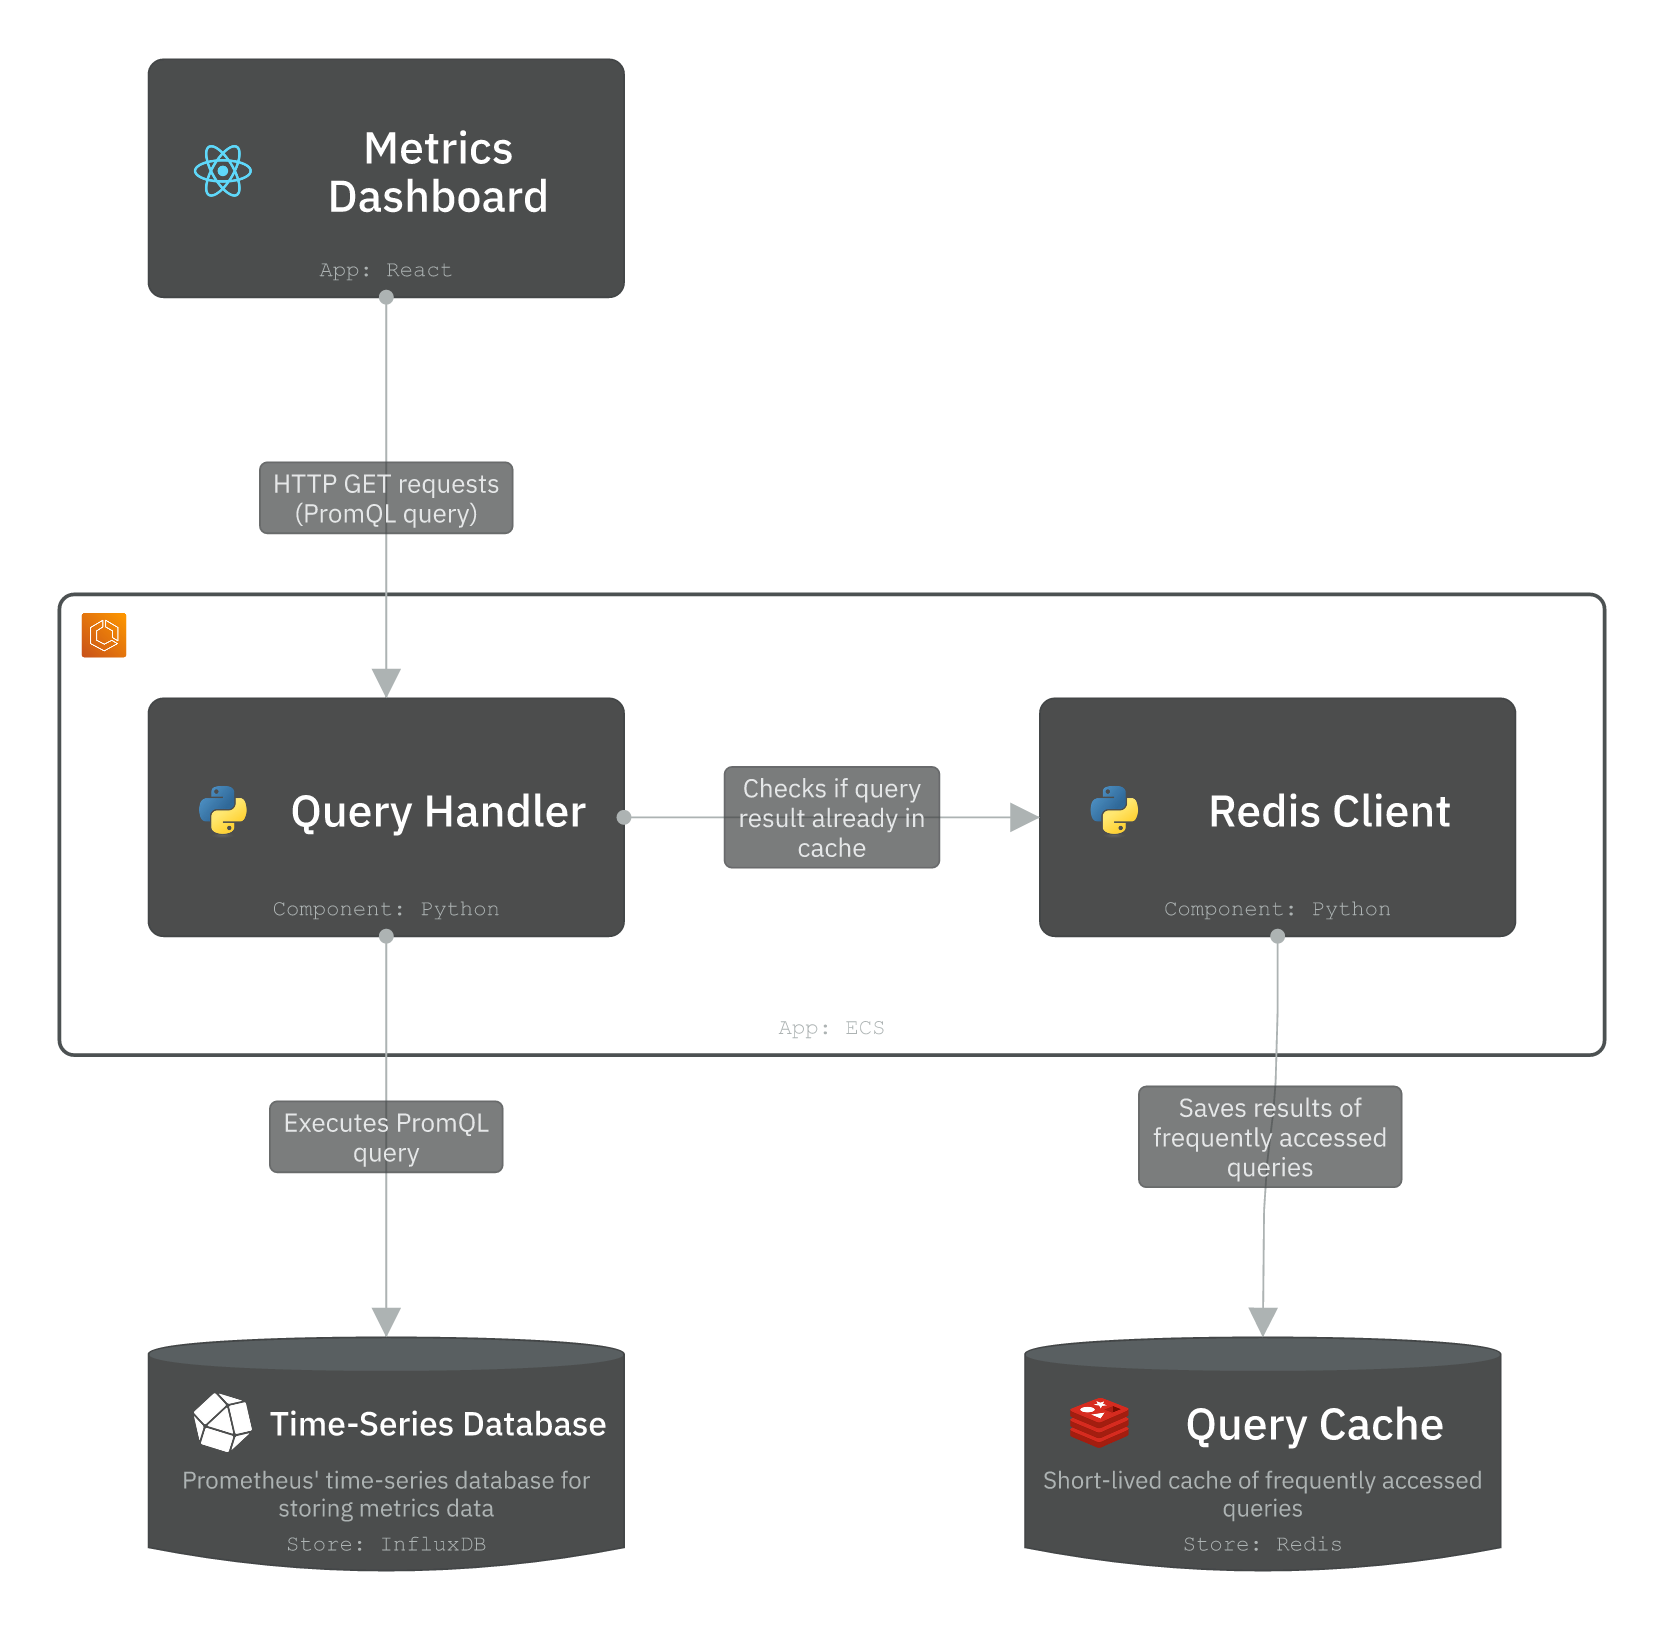
3. Query Service
Query Service is Grafana’s core backend. It receives PromQL query requests from the Metrics Dashboard and executes them against the TSDB. It also caches short-lived query results to Redis to serve repeatable queries.
Query Handler: Receives HTTP GET requests from the Metrics Dashboard containing PromQL expressions. It validates the query, checks Redis for a cached result first, and falls back to executing directly against the TSDB on a cache miss.
The cache is particularly valuable for dashboard panels that auto-refresh every few seconds. Without caching, every render will hit the TSDB directly and create a spiky read load.
Let’s go one level deeper with the source code in the Code layer.
Level 4 - Code
At the code level, we focus on implementation structure rather than deployment. Rather than showing full implementations, we model the public API of each component and the contracts between them. This maps directly to the components described at Level 3. We’ll briefly describe two components: Prometheus Server and Alert Manager.
1. Prometheus Server (Rule Evaluator)
The Rule Evaluator is the core evaluation loop inside Prometheus Server. It loads alert rule groups from YAML config files, each containing one or more rules with a PromQL expression, a threshold, and a duration (how long a breach must persist before the alert fires). On every evaluation tick it queries the TSDB and compares results. If a rule is breached, it hands the alert to the Notifier.
- class AlertRule
- name: e.g. “HighCPUUsage”
- expr: PromQL expression, e.g. “cpu_usage > 0.9”
- for_duration: seconds a breach must persist before firing
- tags: alert labels in key-value pairs
- class RuleEvaluator
- def load_rules(config_path): Load and parse alert rule groups from a YAML file
- def evaluate(rule: AlertRule): Executes the rule’s PromQL against the TSDB
- def run_evaluation_loop(interval_seconds): Evaluates loaded rules on every tick
2. Alert Manager
The Alert Manager receives fired alerts from Prometheus Server and handles the full routing, deduplication, and dispatch lifecycle. It stores the state of the alerts, and handles the dispatch to an alert consumer via a Kafka topic.
- class Alert
- name: e.g., “HighCPUUsage”
- tags: e.g. {“severity”: “critical”, “env”: “prod”}
- annotations: e.g. {“summary”: “CPU > 90%”}
- state: e.g., inactive, pending, firing, resolved
- fired_at:
- resolved_at:
- class AlertReceiver: HTTP handler for Prometheus Server.
- def receive(alerts: list[Alert]): Accepts a batch of alerts from Prometheus Server
- class AlertStore: DynamoDB client for persisting alert state.
- def save(alert: Alert): Persist an alert and its current state to DynamoDB.
- def get_all_firing(): Return all alerts currently in “firing” state.
- class AlertDispatcher: Kafka client that publishes alert events to the alerts topic.
- def dispatch(alert: Alert): Serialize alert and publish to the Kafka alerts topic.
- def get_receiver(alert: Alert): Resolve which receiver this alert should be routed to.
Conclusion
In this post, we designed a Metrics Monitoring & Alerting System using the C4 model on IcePanel. We began with the core requirements and modelled the system top-down, starting with the Context layer, followed by Container, Component, and Code.
We covered several architectural decisions worth taking away from this design.
- Pull vs push model: We used Prometheus’s pull model to scrape targets rather than receiving pushed metrics. It keeps the collectors in control of what’s monitored without pushing unwanted data.
- Consistent hash ring: We used a coordination component (etcd/zookeeper) to distribute scrape targets across a collector pool without duplication.
- Data storage system: We covered the access patterns for a write-heavy system and used a TSDB optimised database like InfluxDB.
- Rule evaluation vs routing: We defined the responsibility of evaluating rules against the TSDB and firing alerts (Prometheus Server). We designed the Alert Manager as a separate container that receives fired alerts and handles deduplication, routing, and dispatch to downstream systems.
If you’d like to see more design deep dives, check out:
- https://icepanel.io/blog/2026-01-28-design-chatgpt-with-icepanel
- https://icepanel.io/blog/2025-10-20-design-ticketmaster-using-icepanel
- https://icepanel.io/blog/2025-11-18-design-youtube-using-icepanel
- https://icepanel.io/blog/2025-12-18-design-ebay-using-icepanel
📚 Resources
- https://prometheus.io/docs/introduction/overview/
- https://grafana.com/docs/grafana/latest/
- https://prometheus.io/docs/alerting/latest/alertmanager/
- https://www.influxdata.com/
- https://kafka.apache.org/42/getting-started/introduction/
- https://flink.apache.org/
- https://aws.amazon.com/cloudwatch/
- https://aws.amazon.com/timestream/
- https://www.pagerduty.com/
